Turkish vs Arapaho No Schooling Completed
COMPARE
Turkish
Arapaho
No Schooling Completed
No Schooling Completed Comparison
Turks
Arapaho
1.8%
NO SCHOOLING COMPLETED
98.7/ 100
METRIC RATING
93rd/ 347
METRIC RANK
2.1%
NO SCHOOLING COMPLETED
45.0/ 100
METRIC RATING
177th/ 347
METRIC RANK
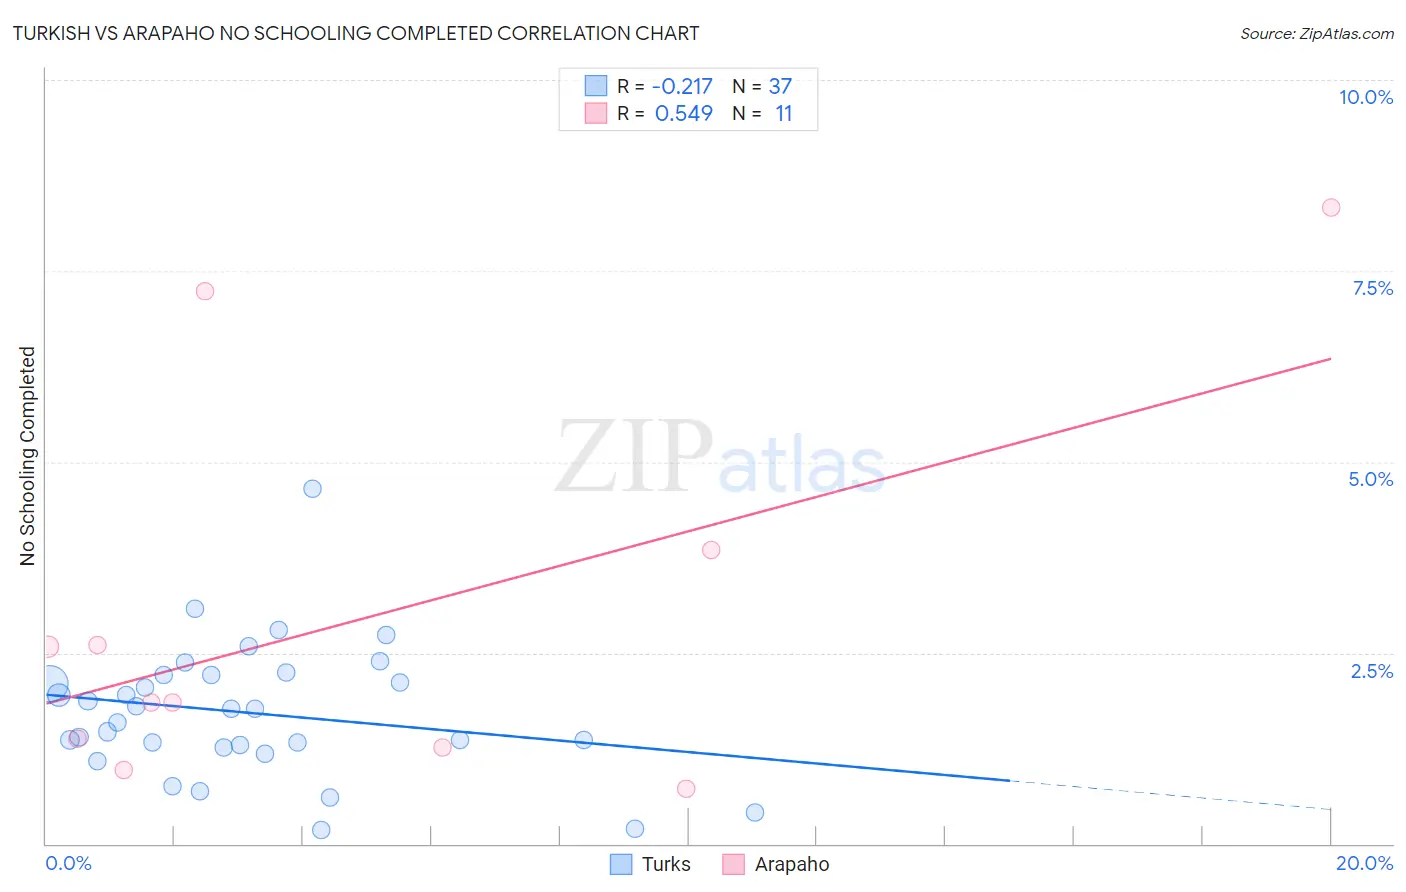
Turkish vs Arapaho No Schooling Completed Correlation Chart
The statistical analysis conducted on geographies consisting of 270,038,657 people shows a weak negative correlation between the proportion of Turks and percentage of population with no schooling in the United States with a correlation coefficient (R) of -0.217 and weighted average of 1.8%. Similarly, the statistical analysis conducted on geographies consisting of 29,619,913 people shows a substantial positive correlation between the proportion of Arapaho and percentage of population with no schooling in the United States with a correlation coefficient (R) of 0.549 and weighted average of 2.1%, a difference of 17.8%.
No Schooling Completed Correlation Summary
| Measurement | Turkish | Arapaho |
| Minimum | 0.19% | 0.72% |
| Maximum | 4.7% | 8.3% |
| Range | 4.5% | 7.6% |
| Mean | 1.7% | 3.0% |
| Median | 1.8% | 1.9% |
| Interquartile 25% (IQ1) | 1.3% | 1.3% |
| Interquartile 75% (IQ3) | 2.2% | 3.8% |
| Interquartile Range (IQR) | 0.94% | 2.6% |
| Standard Deviation (Sample) | 0.87% | 2.5% |
| Standard Deviation (Population) | 0.86% | 2.4% |
Similar Demographics by No Schooling Completed
Demographics Similar to Turks by No Schooling Completed
In terms of no schooling completed, the demographic groups most similar to Turks are Romanian (1.8%, a difference of 0.37%), Nonimmigrants (1.8%, a difference of 0.50%), Puget Sound Salish (1.8%, a difference of 0.51%), Bhutanese (1.8%, a difference of 0.74%), and Immigrants from Germany (1.8%, a difference of 0.89%).
| Demographics | Rating | Rank | No Schooling Completed |
| Ukrainians | 99.2 /100 | #86 | Exceptional 1.8% |
| Osage | 99.2 /100 | #87 | Exceptional 1.8% |
| Immigrants | Western Europe | 99.2 /100 | #88 | Exceptional 1.8% |
| South Africans | 99.1 /100 | #89 | Exceptional 1.8% |
| Sioux | 99.0 /100 | #90 | Exceptional 1.8% |
| Immigrants | Germany | 99.0 /100 | #91 | Exceptional 1.8% |
| Romanians | 98.8 /100 | #92 | Exceptional 1.8% |
| Turks | 98.7 /100 | #93 | Exceptional 1.8% |
| Immigrants | Nonimmigrants | 98.5 /100 | #94 | Exceptional 1.8% |
| Puget Sound Salish | 98.5 /100 | #95 | Exceptional 1.8% |
| Bhutanese | 98.4 /100 | #96 | Exceptional 1.8% |
| Immigrants | Ireland | 98.4 /100 | #97 | Exceptional 1.8% |
| Iranians | 98.2 /100 | #98 | Exceptional 1.8% |
| Choctaw | 98.1 /100 | #99 | Exceptional 1.8% |
| Immigrants | Singapore | 98.0 /100 | #100 | Exceptional 1.8% |
Demographics Similar to Arapaho by No Schooling Completed
In terms of no schooling completed, the demographic groups most similar to Arapaho are Panamanian (2.1%, a difference of 0.020%), Pakistani (2.1%, a difference of 0.040%), Immigrants from Kazakhstan (2.1%, a difference of 0.10%), Portuguese (2.1%, a difference of 0.16%), and Arab (2.1%, a difference of 0.19%).
| Demographics | Rating | Rank | No Schooling Completed |
| Argentineans | 56.0 /100 | #170 | Average 2.1% |
| Immigrants | Poland | 55.2 /100 | #171 | Average 2.1% |
| Immigrants | Argentina | 52.7 /100 | #172 | Average 2.1% |
| Immigrants | Belarus | 51.8 /100 | #173 | Average 2.1% |
| Immigrants | Micronesia | 50.0 /100 | #174 | Average 2.1% |
| Arabs | 46.4 /100 | #175 | Average 2.1% |
| Panamanians | 45.2 /100 | #176 | Average 2.1% |
| Arapaho | 45.0 /100 | #177 | Average 2.1% |
| Pakistanis | 44.7 /100 | #178 | Average 2.1% |
| Immigrants | Kazakhstan | 44.3 /100 | #179 | Average 2.1% |
| Portuguese | 43.9 /100 | #180 | Average 2.1% |
| Immigrants | Taiwan | 42.6 /100 | #181 | Average 2.1% |
| French American Indians | 42.2 /100 | #182 | Average 2.1% |
| Blacks/African Americans | 41.4 /100 | #183 | Average 2.1% |
| Pima | 41.3 /100 | #184 | Average 2.1% |