Turkish vs Immigrants from North Macedonia No Schooling Completed
COMPARE
Turkish
Immigrants from North Macedonia
No Schooling Completed
No Schooling Completed Comparison
Turks
Immigrants from North Macedonia
1.8%
NO SCHOOLING COMPLETED
98.7/ 100
METRIC RATING
93rd/ 347
METRIC RANK
2.0%
NO SCHOOLING COMPLETED
75.9/ 100
METRIC RATING
149th/ 347
METRIC RANK
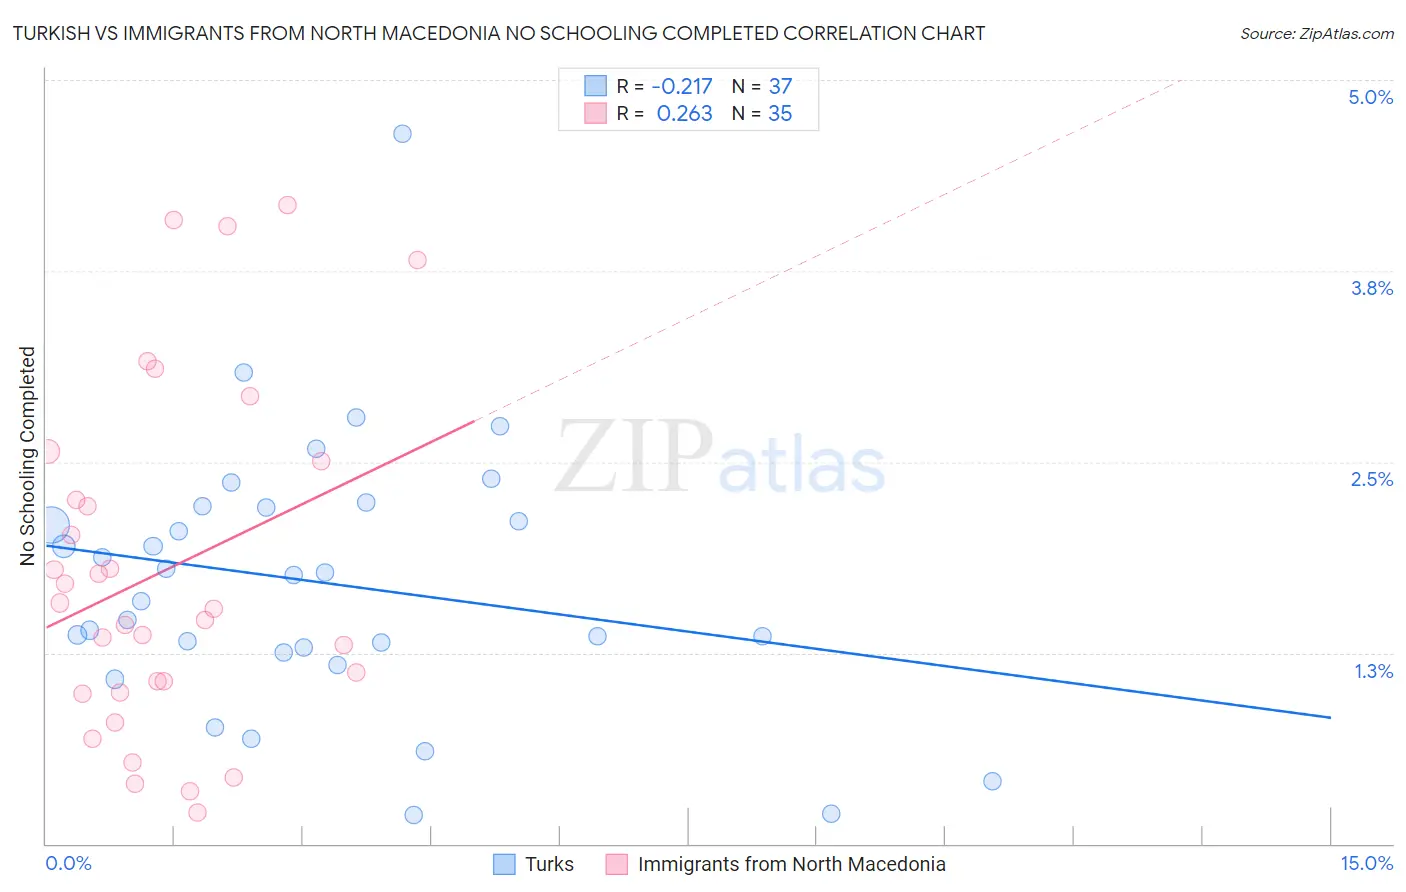
Turkish vs Immigrants from North Macedonia No Schooling Completed Correlation Chart
The statistical analysis conducted on geographies consisting of 270,038,657 people shows a weak negative correlation between the proportion of Turks and percentage of population with no schooling in the United States with a correlation coefficient (R) of -0.217 and weighted average of 1.8%. Similarly, the statistical analysis conducted on geographies consisting of 74,003,033 people shows a weak positive correlation between the proportion of Immigrants from North Macedonia and percentage of population with no schooling in the United States with a correlation coefficient (R) of 0.263 and weighted average of 2.0%, a difference of 12.5%.
No Schooling Completed Correlation Summary
| Measurement | Turkish | Immigrants from North Macedonia |
| Minimum | 0.19% | 0.20% |
| Maximum | 4.7% | 4.2% |
| Range | 4.5% | 4.0% |
| Mean | 1.7% | 1.8% |
| Median | 1.8% | 1.5% |
| Interquartile 25% (IQ1) | 1.3% | 0.99% |
| Interquartile 75% (IQ3) | 2.2% | 2.5% |
| Interquartile Range (IQR) | 0.94% | 1.5% |
| Standard Deviation (Sample) | 0.87% | 1.1% |
| Standard Deviation (Population) | 0.86% | 1.1% |
Similar Demographics by No Schooling Completed
Demographics Similar to Turks by No Schooling Completed
In terms of no schooling completed, the demographic groups most similar to Turks are Romanian (1.8%, a difference of 0.37%), Nonimmigrants (1.8%, a difference of 0.50%), Puget Sound Salish (1.8%, a difference of 0.51%), Bhutanese (1.8%, a difference of 0.74%), and Immigrants from Germany (1.8%, a difference of 0.89%).
| Demographics | Rating | Rank | No Schooling Completed |
| Ukrainians | 99.2 /100 | #86 | Exceptional 1.8% |
| Osage | 99.2 /100 | #87 | Exceptional 1.8% |
| Immigrants | Western Europe | 99.2 /100 | #88 | Exceptional 1.8% |
| South Africans | 99.1 /100 | #89 | Exceptional 1.8% |
| Sioux | 99.0 /100 | #90 | Exceptional 1.8% |
| Immigrants | Germany | 99.0 /100 | #91 | Exceptional 1.8% |
| Romanians | 98.8 /100 | #92 | Exceptional 1.8% |
| Turks | 98.7 /100 | #93 | Exceptional 1.8% |
| Immigrants | Nonimmigrants | 98.5 /100 | #94 | Exceptional 1.8% |
| Puget Sound Salish | 98.5 /100 | #95 | Exceptional 1.8% |
| Bhutanese | 98.4 /100 | #96 | Exceptional 1.8% |
| Immigrants | Ireland | 98.4 /100 | #97 | Exceptional 1.8% |
| Iranians | 98.2 /100 | #98 | Exceptional 1.8% |
| Choctaw | 98.1 /100 | #99 | Exceptional 1.8% |
| Immigrants | Singapore | 98.0 /100 | #100 | Exceptional 1.8% |
Demographics Similar to Immigrants from North Macedonia by No Schooling Completed
In terms of no schooling completed, the demographic groups most similar to Immigrants from North Macedonia are Shoshone (2.0%, a difference of 0.15%), Soviet Union (2.0%, a difference of 0.24%), Immigrants from Moldova (2.0%, a difference of 0.41%), Blackfeet (2.0%, a difference of 0.56%), and Alsatian (2.0%, a difference of 0.63%).
| Demographics | Rating | Rank | No Schooling Completed |
| Venezuelans | 81.5 /100 | #142 | Excellent 2.0% |
| Immigrants | South Central Asia | 80.0 /100 | #143 | Good 2.0% |
| Alsatians | 79.1 /100 | #144 | Good 2.0% |
| Immigrants | Iran | 79.0 /100 | #145 | Good 2.0% |
| Immigrants | Moldova | 78.0 /100 | #146 | Good 2.0% |
| Soviet Union | 77.1 /100 | #147 | Good 2.0% |
| Shoshone | 76.7 /100 | #148 | Good 2.0% |
| Immigrants | North Macedonia | 75.9 /100 | #149 | Good 2.0% |
| Blackfeet | 72.9 /100 | #150 | Good 2.0% |
| Immigrants | Jordan | 70.9 /100 | #151 | Good 2.0% |
| Immigrants | Eastern Europe | 70.4 /100 | #152 | Good 2.0% |
| Immigrants | Italy | 68.9 /100 | #153 | Good 2.0% |
| Immigrants | Venezuela | 68.5 /100 | #154 | Good 2.0% |
| Immigrants | Russia | 67.6 /100 | #155 | Good 2.0% |
| Chileans | 67.2 /100 | #156 | Good 2.0% |