Turkish vs Immigrants from Lebanon No Schooling Completed
COMPARE
Turkish
Immigrants from Lebanon
No Schooling Completed
No Schooling Completed Comparison
Turks
Immigrants from Lebanon
1.8%
NO SCHOOLING COMPLETED
98.7/ 100
METRIC RATING
93rd/ 347
METRIC RANK
2.3%
NO SCHOOLING COMPLETED
4.5/ 100
METRIC RATING
223rd/ 347
METRIC RANK
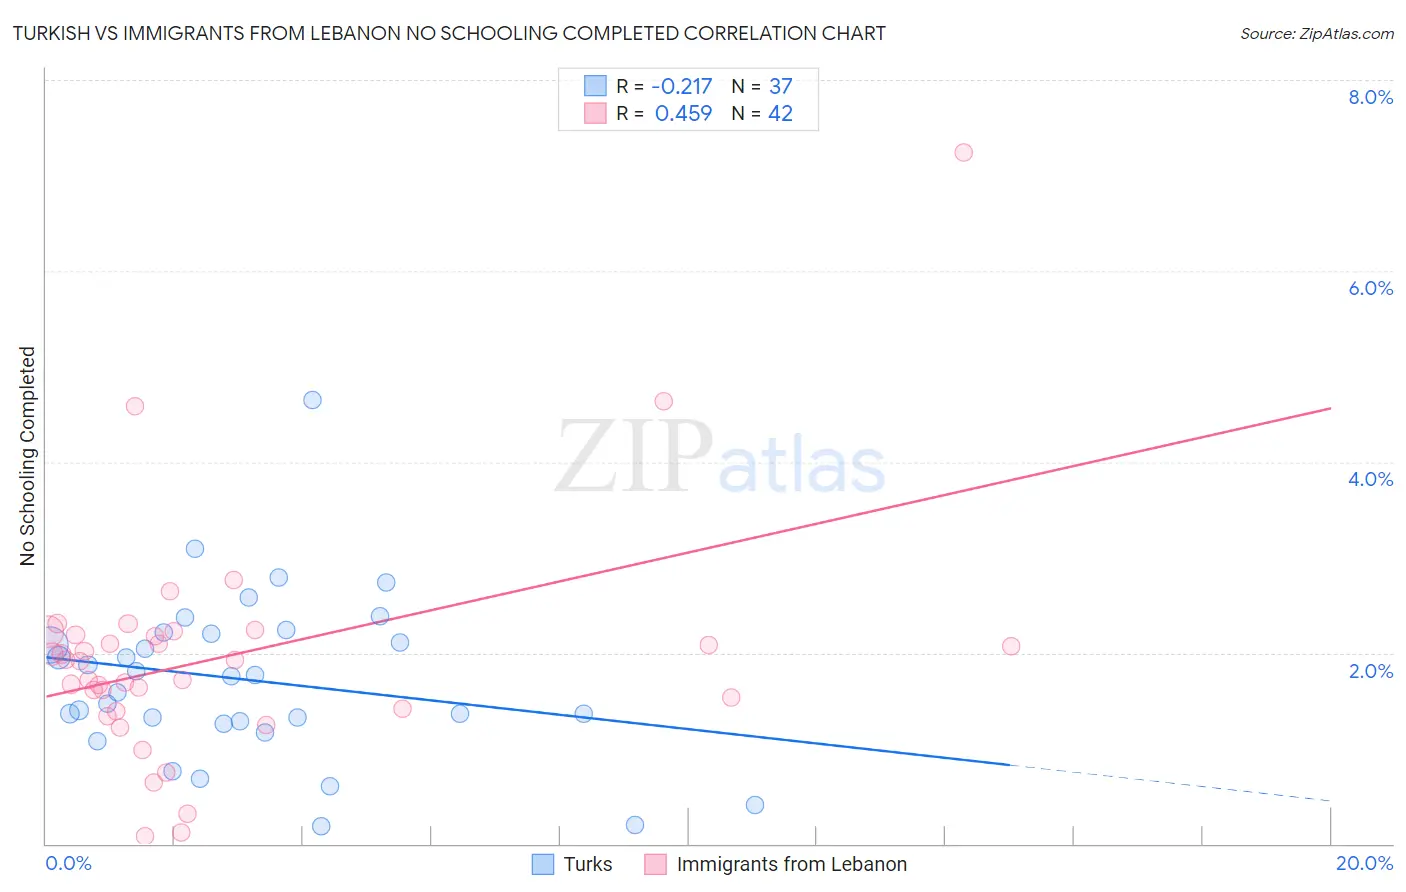
Turkish vs Immigrants from Lebanon No Schooling Completed Correlation Chart
The statistical analysis conducted on geographies consisting of 270,038,657 people shows a weak negative correlation between the proportion of Turks and percentage of population with no schooling in the United States with a correlation coefficient (R) of -0.217 and weighted average of 1.8%. Similarly, the statistical analysis conducted on geographies consisting of 216,259,293 people shows a moderate positive correlation between the proportion of Immigrants from Lebanon and percentage of population with no schooling in the United States with a correlation coefficient (R) of 0.459 and weighted average of 2.3%, a difference of 29.0%.
No Schooling Completed Correlation Summary
| Measurement | Turkish | Immigrants from Lebanon |
| Minimum | 0.19% | 0.079% |
| Maximum | 4.7% | 7.2% |
| Range | 4.5% | 7.2% |
| Mean | 1.7% | 2.0% |
| Median | 1.8% | 1.9% |
| Interquartile 25% (IQ1) | 1.3% | 1.4% |
| Interquartile 75% (IQ3) | 2.2% | 2.2% |
| Interquartile Range (IQR) | 0.94% | 0.77% |
| Standard Deviation (Sample) | 0.87% | 1.2% |
| Standard Deviation (Population) | 0.86% | 1.2% |
Similar Demographics by No Schooling Completed
Demographics Similar to Turks by No Schooling Completed
In terms of no schooling completed, the demographic groups most similar to Turks are Romanian (1.8%, a difference of 0.37%), Nonimmigrants (1.8%, a difference of 0.50%), Puget Sound Salish (1.8%, a difference of 0.51%), Bhutanese (1.8%, a difference of 0.74%), and Immigrants from Germany (1.8%, a difference of 0.89%).
| Demographics | Rating | Rank | No Schooling Completed |
| Ukrainians | 99.2 /100 | #86 | Exceptional 1.8% |
| Osage | 99.2 /100 | #87 | Exceptional 1.8% |
| Immigrants | Western Europe | 99.2 /100 | #88 | Exceptional 1.8% |
| South Africans | 99.1 /100 | #89 | Exceptional 1.8% |
| Sioux | 99.0 /100 | #90 | Exceptional 1.8% |
| Immigrants | Germany | 99.0 /100 | #91 | Exceptional 1.8% |
| Romanians | 98.8 /100 | #92 | Exceptional 1.8% |
| Turks | 98.7 /100 | #93 | Exceptional 1.8% |
| Immigrants | Nonimmigrants | 98.5 /100 | #94 | Exceptional 1.8% |
| Puget Sound Salish | 98.5 /100 | #95 | Exceptional 1.8% |
| Bhutanese | 98.4 /100 | #96 | Exceptional 1.8% |
| Immigrants | Ireland | 98.4 /100 | #97 | Exceptional 1.8% |
| Iranians | 98.2 /100 | #98 | Exceptional 1.8% |
| Choctaw | 98.1 /100 | #99 | Exceptional 1.8% |
| Immigrants | Singapore | 98.0 /100 | #100 | Exceptional 1.8% |
Demographics Similar to Immigrants from Lebanon by No Schooling Completed
In terms of no schooling completed, the demographic groups most similar to Immigrants from Lebanon are Subsaharan African (2.3%, a difference of 0.15%), Tohono O'odham (2.3%, a difference of 0.29%), Sudanese (2.3%, a difference of 0.29%), Sierra Leonean (2.3%, a difference of 0.30%), and Immigrants from Sudan (2.3%, a difference of 0.33%).
| Demographics | Rating | Rank | No Schooling Completed |
| Tongans | 6.8 /100 | #216 | Tragic 2.3% |
| Immigrants | Syria | 6.6 /100 | #217 | Tragic 2.3% |
| Immigrants | Nepal | 6.4 /100 | #218 | Tragic 2.3% |
| Senegalese | 5.6 /100 | #219 | Tragic 2.3% |
| Immigrants | Costa Rica | 5.1 /100 | #220 | Tragic 2.3% |
| Immigrants | Sudan | 5.0 /100 | #221 | Tragic 2.3% |
| Sub-Saharan Africans | 4.7 /100 | #222 | Tragic 2.3% |
| Immigrants | Lebanon | 4.5 /100 | #223 | Tragic 2.3% |
| Tohono O'odham | 4.1 /100 | #224 | Tragic 2.3% |
| Sudanese | 4.1 /100 | #225 | Tragic 2.3% |
| Sierra Leoneans | 4.1 /100 | #226 | Tragic 2.3% |
| Immigrants | Uganda | 4.0 /100 | #227 | Tragic 2.3% |
| U.S. Virgin Islanders | 3.7 /100 | #228 | Tragic 2.3% |
| Immigrants | Pakistan | 3.6 /100 | #229 | Tragic 2.3% |
| Puerto Ricans | 3.4 /100 | #230 | Tragic 2.3% |