Turkish vs Immigrants from Fiji Doctorate Degree
COMPARE
Turkish
Immigrants from Fiji
Doctorate Degree
Doctorate Degree Comparison
Turks
Immigrants from Fiji
2.7%
DOCTORATE DEGREE
100.0/ 100
METRIC RATING
26th/ 347
METRIC RANK
1.6%
DOCTORATE DEGREE
1.6/ 100
METRIC RATING
250th/ 347
METRIC RANK
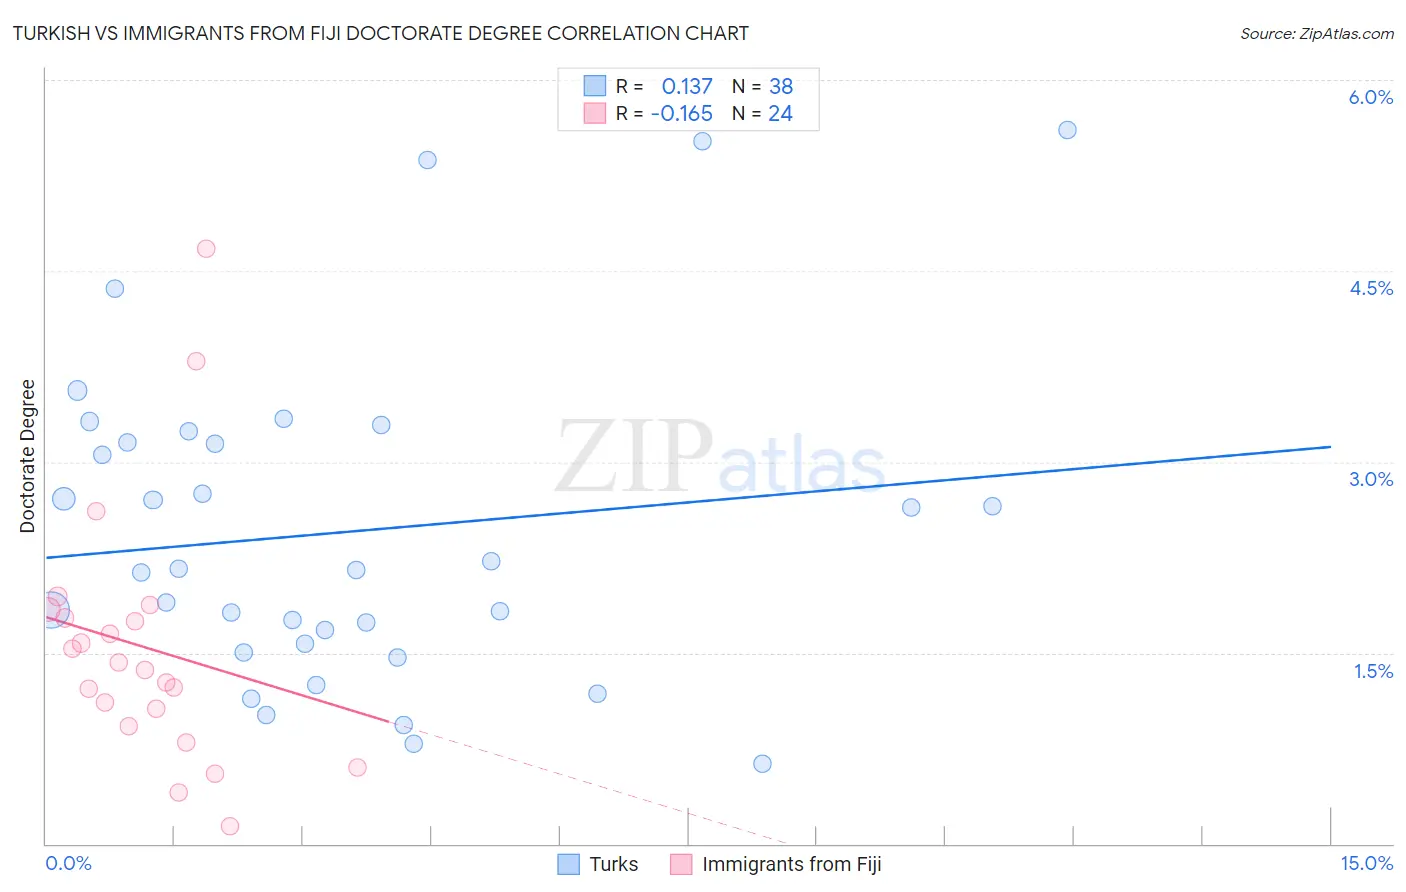
Turkish vs Immigrants from Fiji Doctorate Degree Correlation Chart
The statistical analysis conducted on geographies consisting of 271,099,789 people shows a poor positive correlation between the proportion of Turks and percentage of population with at least doctorate degree education in the United States with a correlation coefficient (R) of 0.137 and weighted average of 2.7%. Similarly, the statistical analysis conducted on geographies consisting of 93,573,075 people shows a poor negative correlation between the proportion of Immigrants from Fiji and percentage of population with at least doctorate degree education in the United States with a correlation coefficient (R) of -0.165 and weighted average of 1.6%, a difference of 70.9%.
Doctorate Degree Correlation Summary
| Measurement | Turkish | Immigrants from Fiji |
| Minimum | 0.63% | 0.14% |
| Maximum | 5.6% | 4.7% |
| Range | 5.0% | 4.5% |
| Mean | 2.4% | 1.5% |
| Median | 2.2% | 1.4% |
| Interquartile 25% (IQ1) | 1.6% | 0.99% |
| Interquartile 75% (IQ3) | 3.2% | 1.8% |
| Interquartile Range (IQR) | 1.6% | 0.82% |
| Standard Deviation (Sample) | 1.3% | 1.0% |
| Standard Deviation (Population) | 1.2% | 0.99% |
Similar Demographics by Doctorate Degree
Demographics Similar to Turks by Doctorate Degree
In terms of doctorate degree, the demographic groups most similar to Turks are Immigrants from Saudi Arabia (2.7%, a difference of 0.52%), Immigrants from Turkey (2.6%, a difference of 0.87%), Burmese (2.6%, a difference of 1.2%), Immigrants from South Central Asia (2.6%, a difference of 1.4%), and Immigrants from Korea (2.6%, a difference of 1.5%).
| Demographics | Rating | Rank | Doctorate Degree |
| Immigrants | Japan | 100.0 /100 | #19 | Exceptional 2.8% |
| Immigrants | Hong Kong | 100.0 /100 | #20 | Exceptional 2.8% |
| Thais | 100.0 /100 | #21 | Exceptional 2.8% |
| Mongolians | 100.0 /100 | #22 | Exceptional 2.8% |
| Immigrants | Denmark | 100.0 /100 | #23 | Exceptional 2.8% |
| Israelis | 100.0 /100 | #24 | Exceptional 2.7% |
| Immigrants | Saudi Arabia | 100.0 /100 | #25 | Exceptional 2.7% |
| Turks | 100.0 /100 | #26 | Exceptional 2.7% |
| Immigrants | Turkey | 100.0 /100 | #27 | Exceptional 2.6% |
| Burmese | 100.0 /100 | #28 | Exceptional 2.6% |
| Immigrants | South Central Asia | 100.0 /100 | #29 | Exceptional 2.6% |
| Immigrants | Korea | 100.0 /100 | #30 | Exceptional 2.6% |
| Latvians | 100.0 /100 | #31 | Exceptional 2.6% |
| Immigrants | Northern Europe | 100.0 /100 | #32 | Exceptional 2.6% |
| Cambodians | 100.0 /100 | #33 | Exceptional 2.6% |
Demographics Similar to Immigrants from Fiji by Doctorate Degree
In terms of doctorate degree, the demographic groups most similar to Immigrants from Fiji are Potawatomi (1.6%, a difference of 0.030%), African (1.6%, a difference of 0.50%), Comanche (1.6%, a difference of 0.61%), Hmong (1.6%, a difference of 0.63%), and Delaware (1.6%, a difference of 0.73%).
| Demographics | Rating | Rank | Doctorate Degree |
| Native Hawaiians | 2.1 /100 | #243 | Tragic 1.6% |
| French American Indians | 2.0 /100 | #244 | Tragic 1.6% |
| Delaware | 1.9 /100 | #245 | Tragic 1.6% |
| Hmong | 1.8 /100 | #246 | Tragic 1.6% |
| Comanche | 1.8 /100 | #247 | Tragic 1.6% |
| Africans | 1.8 /100 | #248 | Tragic 1.6% |
| Potawatomi | 1.6 /100 | #249 | Tragic 1.6% |
| Immigrants | Fiji | 1.6 /100 | #250 | Tragic 1.6% |
| Apache | 1.3 /100 | #251 | Tragic 1.5% |
| Yuman | 1.1 /100 | #252 | Tragic 1.5% |
| Americans | 1.0 /100 | #253 | Tragic 1.5% |
| Immigrants | Cambodia | 1.0 /100 | #254 | Tragic 1.5% |
| Trinidadians and Tobagonians | 1.0 /100 | #255 | Tragic 1.5% |
| Central American Indians | 1.0 /100 | #256 | Tragic 1.5% |
| Chippewa | 0.9 /100 | #257 | Tragic 1.5% |