Menominee vs Immigrants from Fiji Doctorate Degree
COMPARE
Menominee
Immigrants from Fiji
Doctorate Degree
Doctorate Degree Comparison
Menominee
Immigrants from Fiji
1.4%
DOCTORATE DEGREE
0.1/ 100
METRIC RATING
313th/ 347
METRIC RANK
1.6%
DOCTORATE DEGREE
1.6/ 100
METRIC RATING
250th/ 347
METRIC RANK
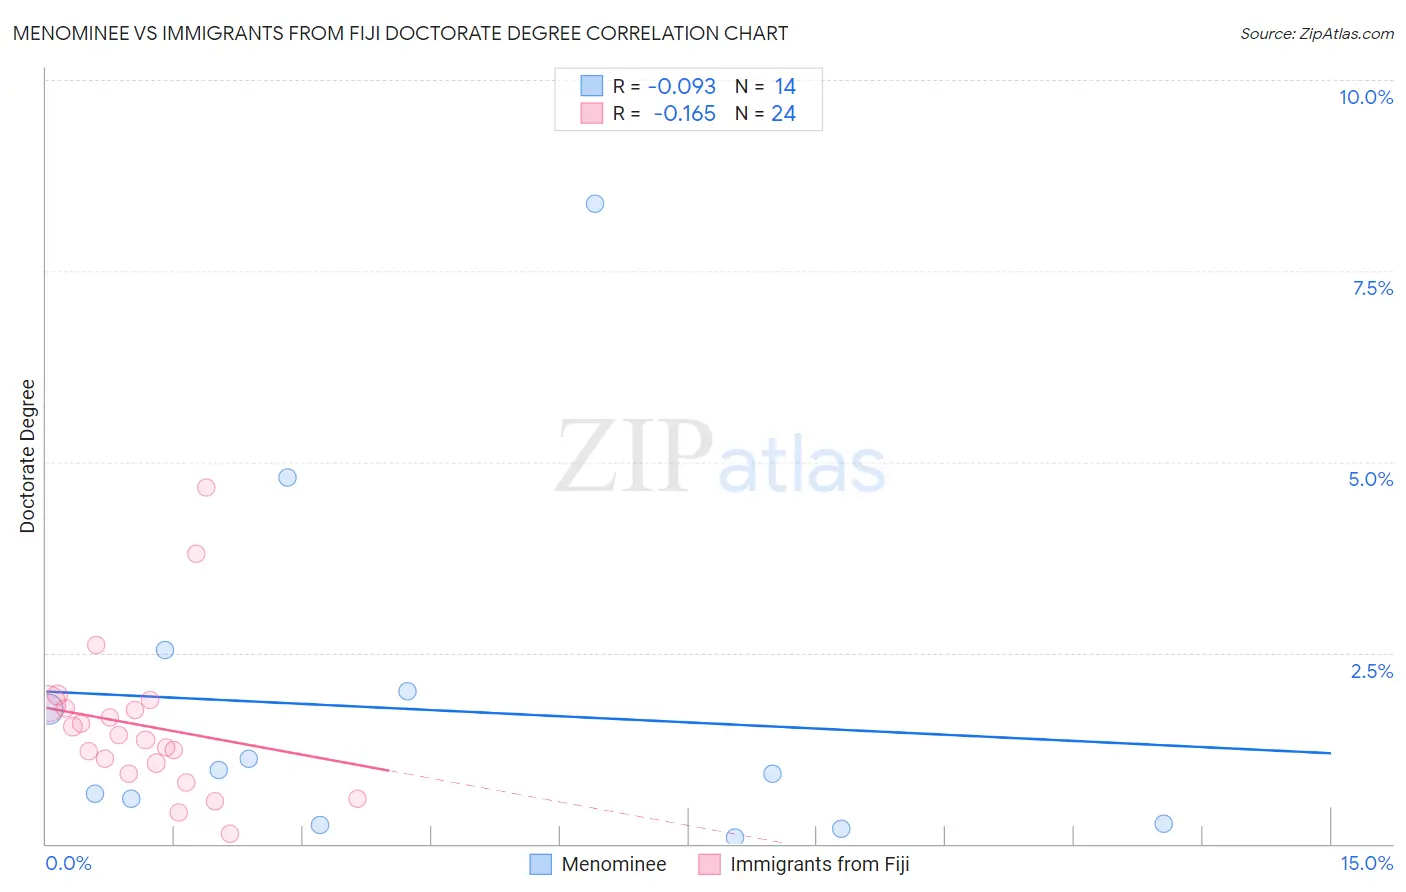
Menominee vs Immigrants from Fiji Doctorate Degree Correlation Chart
The statistical analysis conducted on geographies consisting of 45,550,616 people shows a slight negative correlation between the proportion of Menominee and percentage of population with at least doctorate degree education in the United States with a correlation coefficient (R) of -0.093 and weighted average of 1.4%. Similarly, the statistical analysis conducted on geographies consisting of 93,573,075 people shows a poor negative correlation between the proportion of Immigrants from Fiji and percentage of population with at least doctorate degree education in the United States with a correlation coefficient (R) of -0.165 and weighted average of 1.6%, a difference of 15.2%.
Doctorate Degree Correlation Summary
| Measurement | Menominee | Immigrants from Fiji |
| Minimum | 0.087% | 0.14% |
| Maximum | 8.4% | 4.7% |
| Range | 8.3% | 4.5% |
| Mean | 1.8% | 1.5% |
| Median | 0.94% | 1.4% |
| Interquartile 25% (IQ1) | 0.26% | 0.99% |
| Interquartile 75% (IQ3) | 2.0% | 1.8% |
| Interquartile Range (IQR) | 1.7% | 0.82% |
| Standard Deviation (Sample) | 2.3% | 1.0% |
| Standard Deviation (Population) | 2.2% | 0.99% |
Similar Demographics by Doctorate Degree
Demographics Similar to Menominee by Doctorate Degree
In terms of doctorate degree, the demographic groups most similar to Menominee are Dominican (1.4%, a difference of 0.080%), Immigrants from the Azores (1.4%, a difference of 0.10%), Navajo (1.4%, a difference of 0.31%), Immigrants from Nicaragua (1.4%, a difference of 0.32%), and Immigrants from Micronesia (1.3%, a difference of 0.55%).
| Demographics | Rating | Rank | Doctorate Degree |
| Guyanese | 0.1 /100 | #306 | Tragic 1.4% |
| Cubans | 0.1 /100 | #307 | Tragic 1.4% |
| Immigrants | Laos | 0.1 /100 | #308 | Tragic 1.4% |
| Immigrants | Grenada | 0.1 /100 | #309 | Tragic 1.4% |
| Immigrants | Jamaica | 0.1 /100 | #310 | Tragic 1.4% |
| Immigrants | Honduras | 0.1 /100 | #311 | Tragic 1.4% |
| Immigrants | Nicaragua | 0.1 /100 | #312 | Tragic 1.4% |
| Menominee | 0.1 /100 | #313 | Tragic 1.4% |
| Dominicans | 0.1 /100 | #314 | Tragic 1.4% |
| Immigrants | Azores | 0.1 /100 | #315 | Tragic 1.4% |
| Navajo | 0.1 /100 | #316 | Tragic 1.4% |
| Immigrants | Micronesia | 0.1 /100 | #317 | Tragic 1.3% |
| Creek | 0.1 /100 | #318 | Tragic 1.3% |
| Immigrants | Guyana | 0.1 /100 | #319 | Tragic 1.3% |
| Immigrants | St. Vincent and the Grenadines | 0.1 /100 | #320 | Tragic 1.3% |
Demographics Similar to Immigrants from Fiji by Doctorate Degree
In terms of doctorate degree, the demographic groups most similar to Immigrants from Fiji are Potawatomi (1.6%, a difference of 0.030%), African (1.6%, a difference of 0.50%), Comanche (1.6%, a difference of 0.61%), Hmong (1.6%, a difference of 0.63%), and Delaware (1.6%, a difference of 0.73%).
| Demographics | Rating | Rank | Doctorate Degree |
| Native Hawaiians | 2.1 /100 | #243 | Tragic 1.6% |
| French American Indians | 2.0 /100 | #244 | Tragic 1.6% |
| Delaware | 1.9 /100 | #245 | Tragic 1.6% |
| Hmong | 1.8 /100 | #246 | Tragic 1.6% |
| Comanche | 1.8 /100 | #247 | Tragic 1.6% |
| Africans | 1.8 /100 | #248 | Tragic 1.6% |
| Potawatomi | 1.6 /100 | #249 | Tragic 1.6% |
| Immigrants | Fiji | 1.6 /100 | #250 | Tragic 1.6% |
| Apache | 1.3 /100 | #251 | Tragic 1.5% |
| Yuman | 1.1 /100 | #252 | Tragic 1.5% |
| Americans | 1.0 /100 | #253 | Tragic 1.5% |
| Immigrants | Cambodia | 1.0 /100 | #254 | Tragic 1.5% |
| Trinidadians and Tobagonians | 1.0 /100 | #255 | Tragic 1.5% |
| Central American Indians | 1.0 /100 | #256 | Tragic 1.5% |
| Chippewa | 0.9 /100 | #257 | Tragic 1.5% |