Nonimmigrants vs Immigrants from Fiji Doctorate Degree
COMPARE
Nonimmigrants
Immigrants from Fiji
Doctorate Degree
Doctorate Degree Comparison
Nonimmigrants
Immigrants from Fiji
1.7%
DOCTORATE DEGREE
8.8/ 100
METRIC RATING
221st/ 347
METRIC RANK
1.6%
DOCTORATE DEGREE
1.6/ 100
METRIC RATING
250th/ 347
METRIC RANK
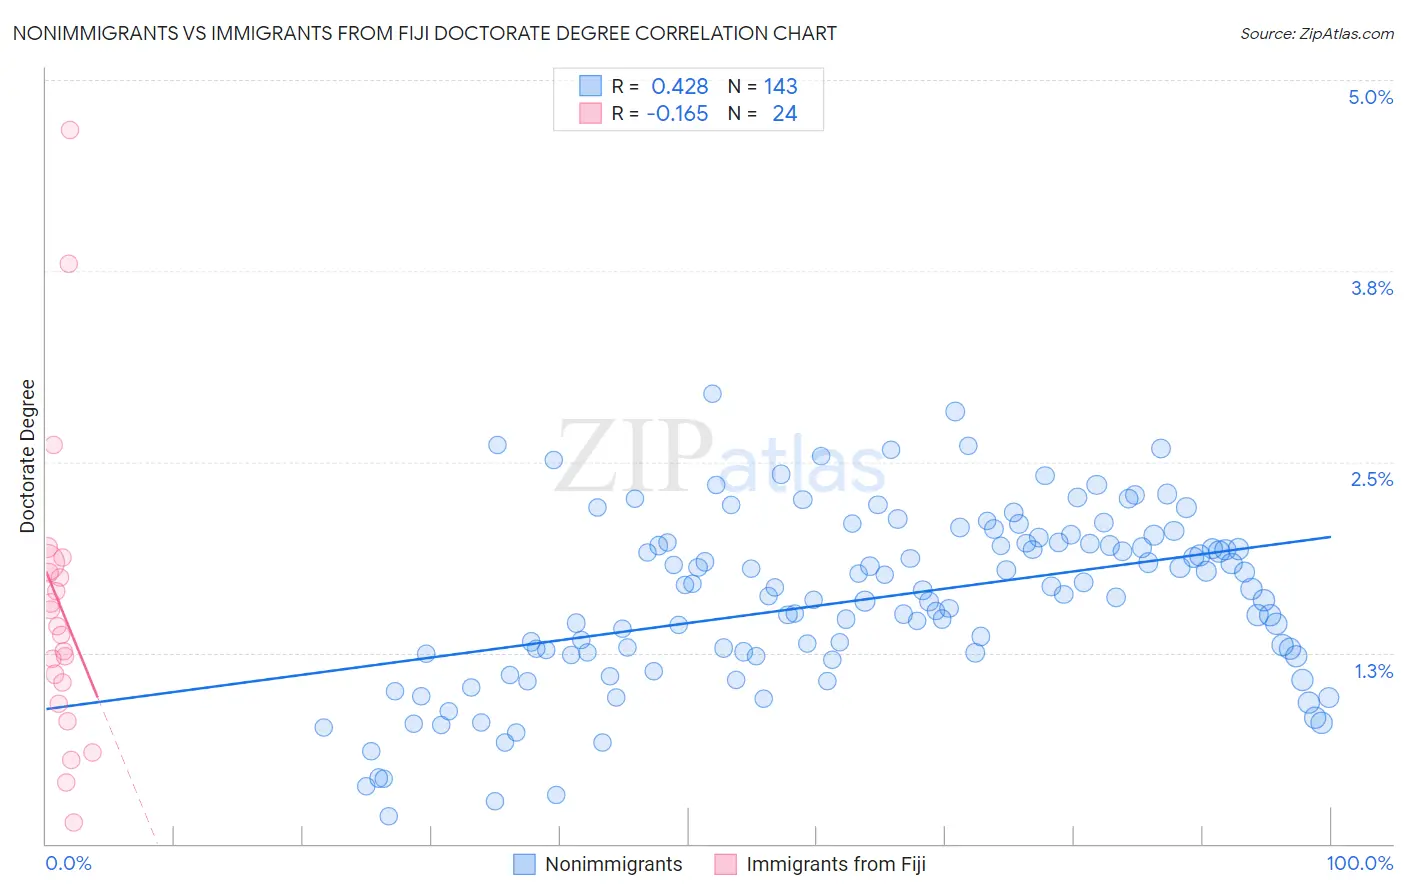
Nonimmigrants vs Immigrants from Fiji Doctorate Degree Correlation Chart
The statistical analysis conducted on geographies consisting of 553,265,434 people shows a moderate positive correlation between the proportion of Nonimmigrants and percentage of population with at least doctorate degree education in the United States with a correlation coefficient (R) of 0.428 and weighted average of 1.7%. Similarly, the statistical analysis conducted on geographies consisting of 93,573,075 people shows a poor negative correlation between the proportion of Immigrants from Fiji and percentage of population with at least doctorate degree education in the United States with a correlation coefficient (R) of -0.165 and weighted average of 1.6%, a difference of 7.7%.
Doctorate Degree Correlation Summary
| Measurement | Nonimmigrants | Immigrants from Fiji |
| Minimum | 0.18% | 0.14% |
| Maximum | 2.9% | 4.7% |
| Range | 2.8% | 4.5% |
| Mean | 1.6% | 1.5% |
| Median | 1.7% | 1.4% |
| Interquartile 25% (IQ1) | 1.2% | 0.99% |
| Interquartile 75% (IQ3) | 2.0% | 1.8% |
| Interquartile Range (IQR) | 0.73% | 0.82% |
| Standard Deviation (Sample) | 0.57% | 1.0% |
| Standard Deviation (Population) | 0.56% | 0.99% |
Similar Demographics by Doctorate Degree
Demographics Similar to Nonimmigrants by Doctorate Degree
In terms of doctorate degree, the demographic groups most similar to Nonimmigrants are Immigrants from Venezuela (1.7%, a difference of 0.070%), Immigrants from Uruguay (1.7%, a difference of 0.19%), Immigrants from Bosnia and Herzegovina (1.7%, a difference of 0.53%), Immigrants from Poland (1.7%, a difference of 0.75%), and Immigrants from Iraq (1.7%, a difference of 0.85%).
| Demographics | Rating | Rank | Doctorate Degree |
| Pueblo | 14.2 /100 | #214 | Poor 1.7% |
| Alaskan Athabascans | 13.8 /100 | #215 | Poor 1.7% |
| Immigrants | Burma/Myanmar | 13.5 /100 | #216 | Poor 1.7% |
| Spanish Americans | 12.9 /100 | #217 | Poor 1.7% |
| Tlingit-Haida | 11.9 /100 | #218 | Poor 1.7% |
| Immigrants | Iraq | 10.7 /100 | #219 | Poor 1.7% |
| Immigrants | Uruguay | 9.2 /100 | #220 | Tragic 1.7% |
| Immigrants | Nonimmigrants | 8.8 /100 | #221 | Tragic 1.7% |
| Immigrants | Venezuela | 8.7 /100 | #222 | Tragic 1.7% |
| Immigrants | Bosnia and Herzegovina | 7.8 /100 | #223 | Tragic 1.7% |
| Immigrants | Poland | 7.4 /100 | #224 | Tragic 1.7% |
| Immigrants | Colombia | 6.7 /100 | #225 | Tragic 1.7% |
| Osage | 6.5 /100 | #226 | Tragic 1.7% |
| Panamanians | 6.3 /100 | #227 | Tragic 1.7% |
| Assyrians/Chaldeans/Syriacs | 5.9 /100 | #228 | Tragic 1.7% |
Demographics Similar to Immigrants from Fiji by Doctorate Degree
In terms of doctorate degree, the demographic groups most similar to Immigrants from Fiji are Potawatomi (1.6%, a difference of 0.030%), African (1.6%, a difference of 0.50%), Comanche (1.6%, a difference of 0.61%), Hmong (1.6%, a difference of 0.63%), and Delaware (1.6%, a difference of 0.73%).
| Demographics | Rating | Rank | Doctorate Degree |
| Native Hawaiians | 2.1 /100 | #243 | Tragic 1.6% |
| French American Indians | 2.0 /100 | #244 | Tragic 1.6% |
| Delaware | 1.9 /100 | #245 | Tragic 1.6% |
| Hmong | 1.8 /100 | #246 | Tragic 1.6% |
| Comanche | 1.8 /100 | #247 | Tragic 1.6% |
| Africans | 1.8 /100 | #248 | Tragic 1.6% |
| Potawatomi | 1.6 /100 | #249 | Tragic 1.6% |
| Immigrants | Fiji | 1.6 /100 | #250 | Tragic 1.6% |
| Apache | 1.3 /100 | #251 | Tragic 1.5% |
| Yuman | 1.1 /100 | #252 | Tragic 1.5% |
| Americans | 1.0 /100 | #253 | Tragic 1.5% |
| Immigrants | Cambodia | 1.0 /100 | #254 | Tragic 1.5% |
| Trinidadians and Tobagonians | 1.0 /100 | #255 | Tragic 1.5% |
| Central American Indians | 1.0 /100 | #256 | Tragic 1.5% |
| Chippewa | 0.9 /100 | #257 | Tragic 1.5% |