Turkish vs Immigrants from Czechoslovakia Doctorate Degree
COMPARE
Turkish
Immigrants from Czechoslovakia
Doctorate Degree
Doctorate Degree Comparison
Turks
Immigrants from Czechoslovakia
2.7%
DOCTORATE DEGREE
100.0/ 100
METRIC RATING
26th/ 347
METRIC RANK
2.4%
DOCTORATE DEGREE
100.0/ 100
METRIC RATING
56th/ 347
METRIC RANK
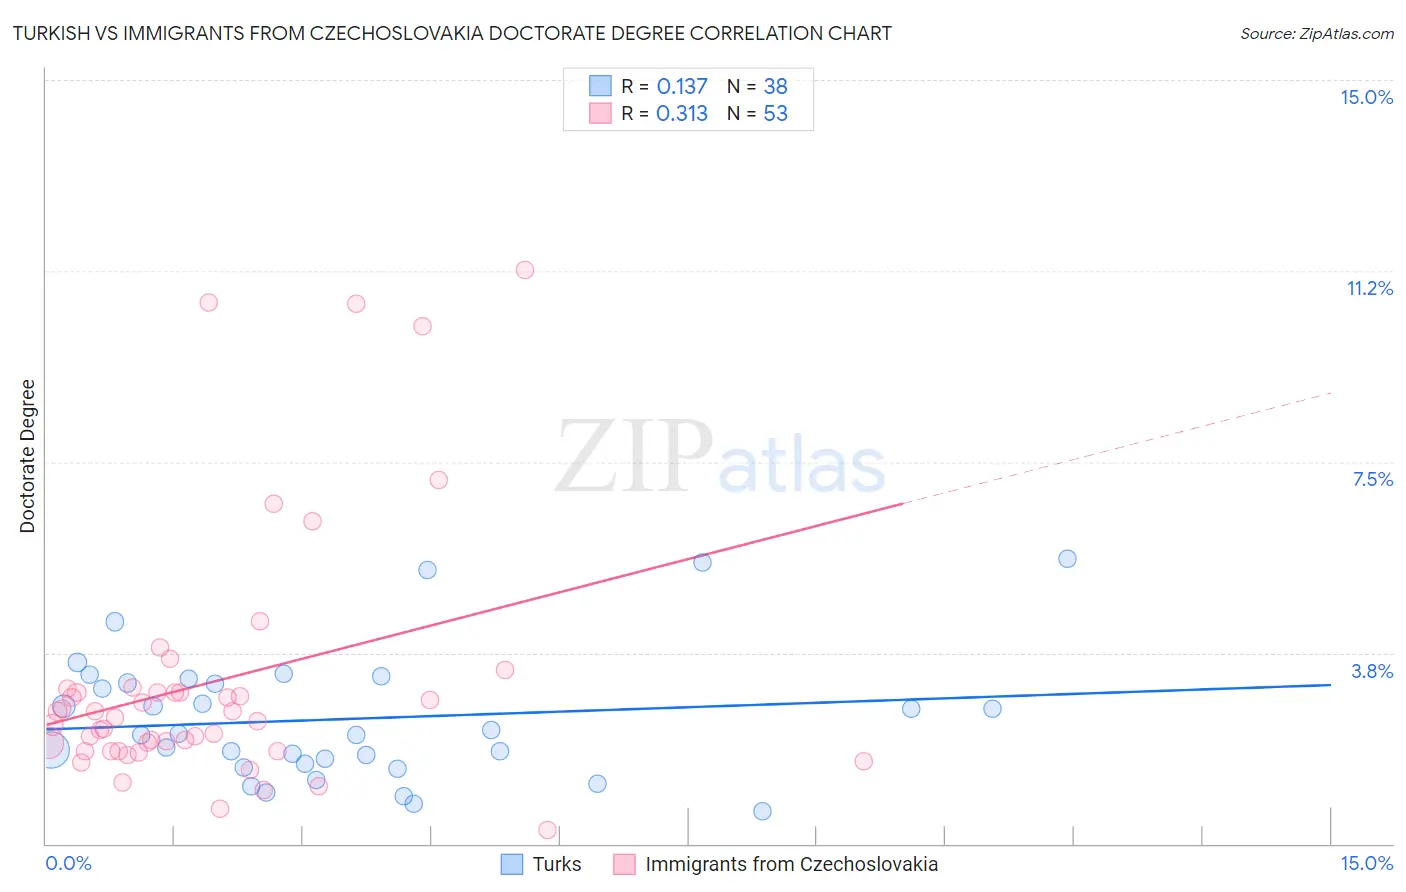
Turkish vs Immigrants from Czechoslovakia Doctorate Degree Correlation Chart
The statistical analysis conducted on geographies consisting of 271,099,789 people shows a poor positive correlation between the proportion of Turks and percentage of population with at least doctorate degree education in the United States with a correlation coefficient (R) of 0.137 and weighted average of 2.7%. Similarly, the statistical analysis conducted on geographies consisting of 195,016,936 people shows a mild positive correlation between the proportion of Immigrants from Czechoslovakia and percentage of population with at least doctorate degree education in the United States with a correlation coefficient (R) of 0.313 and weighted average of 2.4%, a difference of 12.8%.
Doctorate Degree Correlation Summary
| Measurement | Turkish | Immigrants from Czechoslovakia |
| Minimum | 0.63% | 0.28% |
| Maximum | 5.6% | 11.3% |
| Range | 5.0% | 11.0% |
| Mean | 2.4% | 3.2% |
| Median | 2.2% | 2.5% |
| Interquartile 25% (IQ1) | 1.6% | 1.8% |
| Interquartile 75% (IQ3) | 3.2% | 3.0% |
| Interquartile Range (IQR) | 1.6% | 1.2% |
| Standard Deviation (Sample) | 1.3% | 2.5% |
| Standard Deviation (Population) | 1.2% | 2.5% |
Similar Demographics by Doctorate Degree
Demographics Similar to Turks by Doctorate Degree
In terms of doctorate degree, the demographic groups most similar to Turks are Immigrants from Saudi Arabia (2.7%, a difference of 0.52%), Immigrants from Turkey (2.6%, a difference of 0.87%), Burmese (2.6%, a difference of 1.2%), Immigrants from South Central Asia (2.6%, a difference of 1.4%), and Immigrants from Korea (2.6%, a difference of 1.5%).
| Demographics | Rating | Rank | Doctorate Degree |
| Immigrants | Japan | 100.0 /100 | #19 | Exceptional 2.8% |
| Immigrants | Hong Kong | 100.0 /100 | #20 | Exceptional 2.8% |
| Thais | 100.0 /100 | #21 | Exceptional 2.8% |
| Mongolians | 100.0 /100 | #22 | Exceptional 2.8% |
| Immigrants | Denmark | 100.0 /100 | #23 | Exceptional 2.8% |
| Israelis | 100.0 /100 | #24 | Exceptional 2.7% |
| Immigrants | Saudi Arabia | 100.0 /100 | #25 | Exceptional 2.7% |
| Turks | 100.0 /100 | #26 | Exceptional 2.7% |
| Immigrants | Turkey | 100.0 /100 | #27 | Exceptional 2.6% |
| Burmese | 100.0 /100 | #28 | Exceptional 2.6% |
| Immigrants | South Central Asia | 100.0 /100 | #29 | Exceptional 2.6% |
| Immigrants | Korea | 100.0 /100 | #30 | Exceptional 2.6% |
| Latvians | 100.0 /100 | #31 | Exceptional 2.6% |
| Immigrants | Northern Europe | 100.0 /100 | #32 | Exceptional 2.6% |
| Cambodians | 100.0 /100 | #33 | Exceptional 2.6% |
Demographics Similar to Immigrants from Czechoslovakia by Doctorate Degree
In terms of doctorate degree, the demographic groups most similar to Immigrants from Czechoslovakia are Bolivian (2.4%, a difference of 0.090%), Immigrants from Indonesia (2.4%, a difference of 0.17%), Immigrants from Ethiopia (2.4%, a difference of 0.44%), Ethiopian (2.3%, a difference of 0.55%), and Immigrants from Latvia (2.4%, a difference of 0.85%).
| Demographics | Rating | Rank | Doctorate Degree |
| Immigrants | Asia | 100.0 /100 | #49 | Exceptional 2.4% |
| Immigrants | Norway | 100.0 /100 | #50 | Exceptional 2.4% |
| Australians | 100.0 /100 | #51 | Exceptional 2.4% |
| Bulgarians | 100.0 /100 | #52 | Exceptional 2.4% |
| Immigrants | Latvia | 100.0 /100 | #53 | Exceptional 2.4% |
| Immigrants | Indonesia | 100.0 /100 | #54 | Exceptional 2.4% |
| Bolivians | 100.0 /100 | #55 | Exceptional 2.4% |
| Immigrants | Czechoslovakia | 100.0 /100 | #56 | Exceptional 2.4% |
| Immigrants | Ethiopia | 100.0 /100 | #57 | Exceptional 2.4% |
| Ethiopians | 99.9 /100 | #58 | Exceptional 2.3% |
| South Africans | 99.9 /100 | #59 | Exceptional 2.3% |
| Immigrants | Serbia | 99.9 /100 | #60 | Exceptional 2.3% |
| Bhutanese | 99.9 /100 | #61 | Exceptional 2.3% |
| Immigrants | Europe | 99.9 /100 | #62 | Exceptional 2.3% |
| Laotians | 99.9 /100 | #63 | Exceptional 2.3% |