Turkish vs Peruvian Doctorate Degree
COMPARE
Turkish
Peruvian
Doctorate Degree
Doctorate Degree Comparison
Turks
Peruvians
2.7%
DOCTORATE DEGREE
100.0/ 100
METRIC RATING
26th/ 347
METRIC RANK
1.8%
DOCTORATE DEGREE
34.4/ 100
METRIC RATING
186th/ 347
METRIC RANK
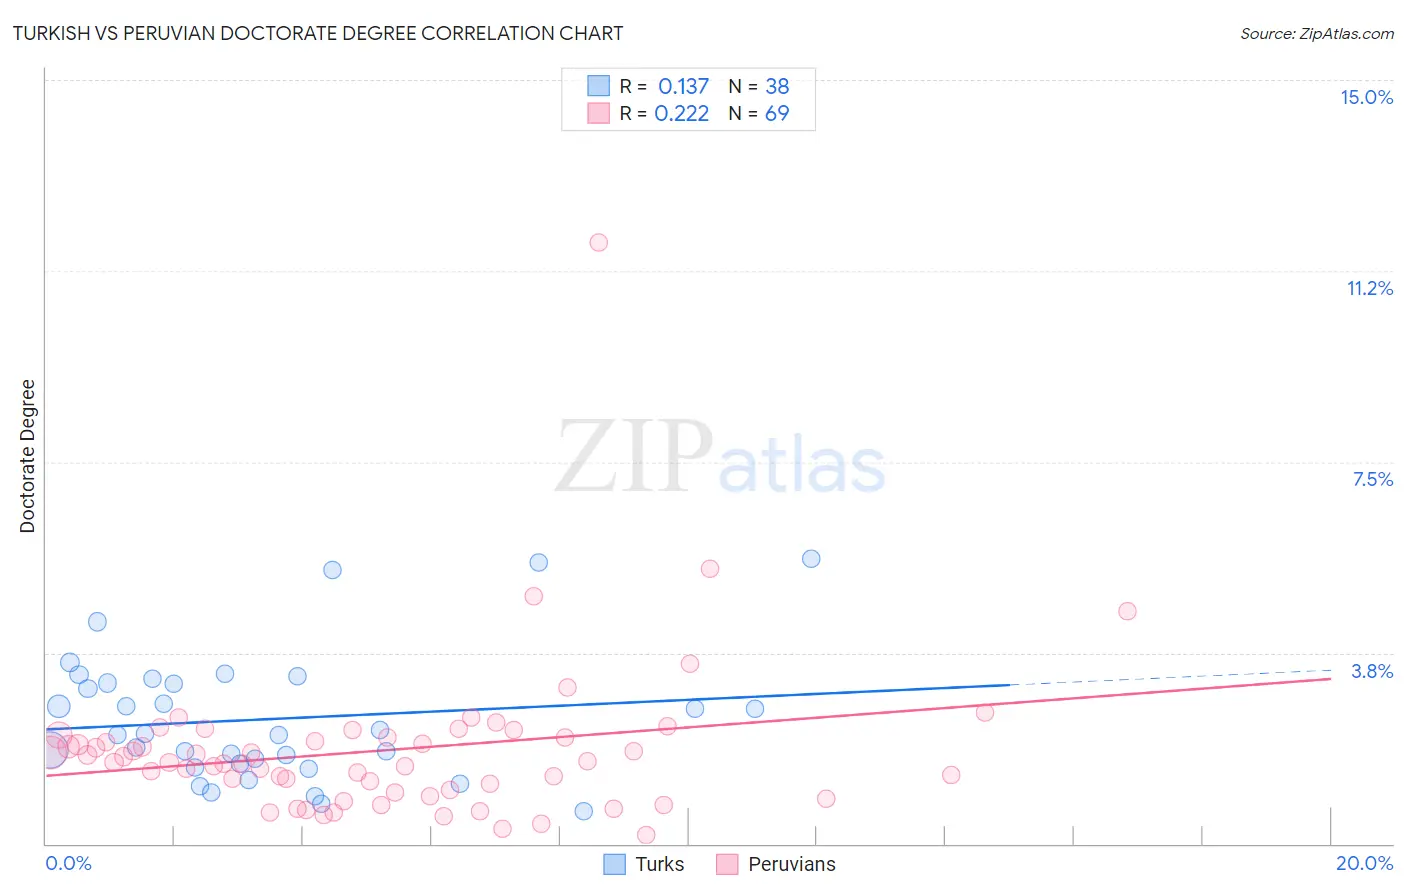
Turkish vs Peruvian Doctorate Degree Correlation Chart
The statistical analysis conducted on geographies consisting of 271,099,789 people shows a poor positive correlation between the proportion of Turks and percentage of population with at least doctorate degree education in the United States with a correlation coefficient (R) of 0.137 and weighted average of 2.7%. Similarly, the statistical analysis conducted on geographies consisting of 360,973,497 people shows a weak positive correlation between the proportion of Peruvians and percentage of population with at least doctorate degree education in the United States with a correlation coefficient (R) of 0.222 and weighted average of 1.8%, a difference of 48.5%.
Doctorate Degree Correlation Summary
| Measurement | Turkish | Peruvian |
| Minimum | 0.63% | 0.17% |
| Maximum | 5.6% | 11.8% |
| Range | 5.0% | 11.6% |
| Mean | 2.4% | 1.8% |
| Median | 2.2% | 1.6% |
| Interquartile 25% (IQ1) | 1.6% | 1.0% |
| Interquartile 75% (IQ3) | 3.2% | 2.1% |
| Interquartile Range (IQR) | 1.6% | 1.1% |
| Standard Deviation (Sample) | 1.3% | 1.6% |
| Standard Deviation (Population) | 1.2% | 1.5% |
Similar Demographics by Doctorate Degree
Demographics Similar to Turks by Doctorate Degree
In terms of doctorate degree, the demographic groups most similar to Turks are Immigrants from Saudi Arabia (2.7%, a difference of 0.52%), Immigrants from Turkey (2.6%, a difference of 0.87%), Burmese (2.6%, a difference of 1.2%), Immigrants from South Central Asia (2.6%, a difference of 1.4%), and Immigrants from Korea (2.6%, a difference of 1.5%).
| Demographics | Rating | Rank | Doctorate Degree |
| Immigrants | Japan | 100.0 /100 | #19 | Exceptional 2.8% |
| Immigrants | Hong Kong | 100.0 /100 | #20 | Exceptional 2.8% |
| Thais | 100.0 /100 | #21 | Exceptional 2.8% |
| Mongolians | 100.0 /100 | #22 | Exceptional 2.8% |
| Immigrants | Denmark | 100.0 /100 | #23 | Exceptional 2.8% |
| Israelis | 100.0 /100 | #24 | Exceptional 2.7% |
| Immigrants | Saudi Arabia | 100.0 /100 | #25 | Exceptional 2.7% |
| Turks | 100.0 /100 | #26 | Exceptional 2.7% |
| Immigrants | Turkey | 100.0 /100 | #27 | Exceptional 2.6% |
| Burmese | 100.0 /100 | #28 | Exceptional 2.6% |
| Immigrants | South Central Asia | 100.0 /100 | #29 | Exceptional 2.6% |
| Immigrants | Korea | 100.0 /100 | #30 | Exceptional 2.6% |
| Latvians | 100.0 /100 | #31 | Exceptional 2.6% |
| Immigrants | Northern Europe | 100.0 /100 | #32 | Exceptional 2.6% |
| Cambodians | 100.0 /100 | #33 | Exceptional 2.6% |
Demographics Similar to Peruvians by Doctorate Degree
In terms of doctorate degree, the demographic groups most similar to Peruvians are Czechoslovakian (1.8%, a difference of 0.23%), Slovak (1.8%, a difference of 0.32%), German (1.8%, a difference of 0.68%), French Canadian (1.8%, a difference of 0.72%), and Immigrants from Costa Rica (1.8%, a difference of 0.73%).
| Demographics | Rating | Rank | Doctorate Degree |
| Ghanaians | 48.3 /100 | #179 | Average 1.8% |
| Scandinavians | 48.0 /100 | #180 | Average 1.8% |
| Immigrants | Immigrants | 46.2 /100 | #181 | Average 1.8% |
| Immigrants | Afghanistan | 44.3 /100 | #182 | Average 1.8% |
| Finns | 42.1 /100 | #183 | Average 1.8% |
| Nigerians | 39.9 /100 | #184 | Fair 1.8% |
| Slovaks | 36.4 /100 | #185 | Fair 1.8% |
| Peruvians | 34.4 /100 | #186 | Fair 1.8% |
| Czechoslovakians | 33.0 /100 | #187 | Fair 1.8% |
| Germans | 30.5 /100 | #188 | Fair 1.8% |
| French Canadians | 30.2 /100 | #189 | Fair 1.8% |
| Immigrants | Costa Rica | 30.2 /100 | #190 | Fair 1.8% |
| South Americans | 29.5 /100 | #191 | Fair 1.8% |
| Dutch | 27.4 /100 | #192 | Fair 1.8% |
| German Russians | 27.1 /100 | #193 | Fair 1.8% |