Immigrants from Croatia vs Immigrants from Caribbean Doctorate Degree
COMPARE
Immigrants from Croatia
Immigrants from Caribbean
Doctorate Degree
Doctorate Degree Comparison
Immigrants from Croatia
Immigrants from Caribbean
2.1%
DOCTORATE DEGREE
96.8/ 100
METRIC RATING
114th/ 347
METRIC RANK
1.3%
DOCTORATE DEGREE
0.0/ 100
METRIC RATING
333rd/ 347
METRIC RANK
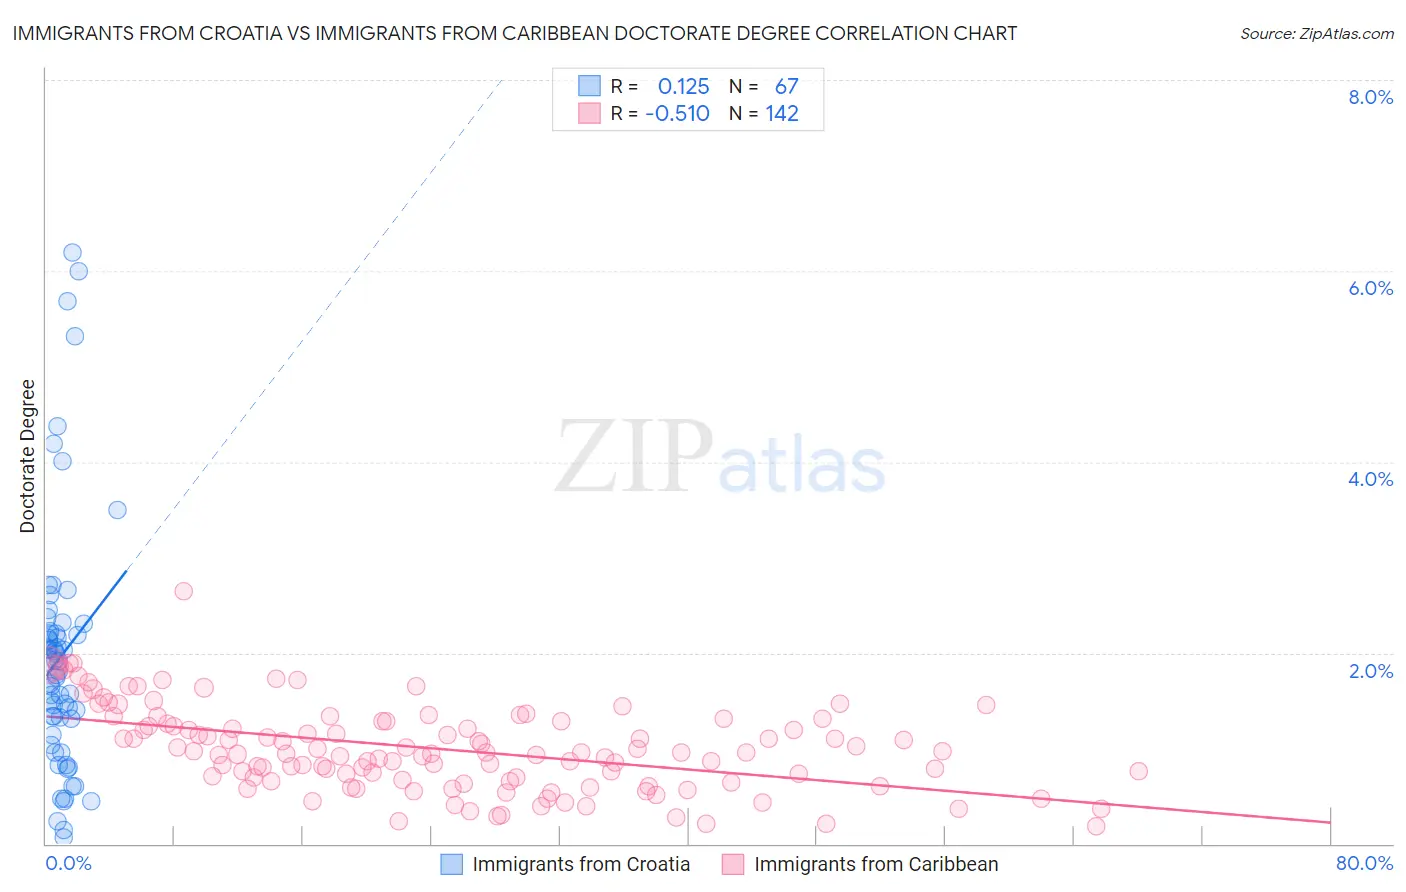
Immigrants from Croatia vs Immigrants from Caribbean Doctorate Degree Correlation Chart
The statistical analysis conducted on geographies consisting of 132,307,639 people shows a poor positive correlation between the proportion of Immigrants from Croatia and percentage of population with at least doctorate degree education in the United States with a correlation coefficient (R) of 0.125 and weighted average of 2.1%. Similarly, the statistical analysis conducted on geographies consisting of 443,887,060 people shows a substantial negative correlation between the proportion of Immigrants from Caribbean and percentage of population with at least doctorate degree education in the United States with a correlation coefficient (R) of -0.510 and weighted average of 1.3%, a difference of 61.4%.
Doctorate Degree Correlation Summary
| Measurement | Immigrants from Croatia | Immigrants from Caribbean |
| Minimum | 0.064% | 0.18% |
| Maximum | 6.2% | 2.6% |
| Range | 6.1% | 2.5% |
| Mean | 2.0% | 1.00% |
| Median | 1.8% | 0.96% |
| Interquartile 25% (IQ1) | 1.1% | 0.67% |
| Interquartile 75% (IQ3) | 2.2% | 1.3% |
| Interquartile Range (IQR) | 1.1% | 0.61% |
| Standard Deviation (Sample) | 1.3% | 0.44% |
| Standard Deviation (Population) | 1.3% | 0.44% |
Similar Demographics by Doctorate Degree
Demographics Similar to Immigrants from Croatia by Doctorate Degree
In terms of doctorate degree, the demographic groups most similar to Immigrants from Croatia are Taiwanese (2.1%, a difference of 0.080%), Immigrants from Italy (2.1%, a difference of 0.15%), Syrian (2.1%, a difference of 0.37%), Immigrants from Pakistan (2.1%, a difference of 0.38%), and Brazilian (2.1%, a difference of 0.44%).
| Demographics | Rating | Rank | Doctorate Degree |
| Europeans | 97.5 /100 | #107 | Exceptional 2.1% |
| Immigrants | Germany | 97.3 /100 | #108 | Exceptional 2.1% |
| Ukrainians | 97.2 /100 | #109 | Exceptional 2.1% |
| Brazilians | 97.2 /100 | #110 | Exceptional 2.1% |
| Immigrants | Pakistan | 97.1 /100 | #111 | Exceptional 2.1% |
| Syrians | 97.1 /100 | #112 | Exceptional 2.1% |
| Immigrants | Italy | 96.9 /100 | #113 | Exceptional 2.1% |
| Immigrants | Croatia | 96.8 /100 | #114 | Exceptional 2.1% |
| Taiwanese | 96.7 /100 | #115 | Exceptional 2.1% |
| Maltese | 96.2 /100 | #116 | Exceptional 2.1% |
| Lebanese | 96.0 /100 | #117 | Exceptional 2.1% |
| Icelanders | 96.0 /100 | #118 | Exceptional 2.1% |
| Pakistanis | 95.8 /100 | #119 | Exceptional 2.0% |
| Immigrants | Morocco | 95.5 /100 | #120 | Exceptional 2.0% |
| Immigrants | Jordan | 94.8 /100 | #121 | Exceptional 2.0% |
Demographics Similar to Immigrants from Caribbean by Doctorate Degree
In terms of doctorate degree, the demographic groups most similar to Immigrants from Caribbean are Yakama (1.3%, a difference of 0.16%), Immigrants from Dominican Republic (1.3%, a difference of 0.19%), Immigrants from Latin America (1.3%, a difference of 1.7%), Yup'ik (1.3%, a difference of 1.8%), and Haitian (1.3%, a difference of 2.0%).
| Demographics | Rating | Rank | Doctorate Degree |
| Immigrants | Cabo Verde | 0.0 /100 | #326 | Tragic 1.3% |
| Hispanics or Latinos | 0.0 /100 | #327 | Tragic 1.3% |
| Inupiat | 0.0 /100 | #328 | Tragic 1.3% |
| Haitians | 0.0 /100 | #329 | Tragic 1.3% |
| Yup'ik | 0.0 /100 | #330 | Tragic 1.3% |
| Immigrants | Latin America | 0.0 /100 | #331 | Tragic 1.3% |
| Yakama | 0.0 /100 | #332 | Tragic 1.3% |
| Immigrants | Caribbean | 0.0 /100 | #333 | Tragic 1.3% |
| Immigrants | Dominican Republic | 0.0 /100 | #334 | Tragic 1.3% |
| Immigrants | Haiti | 0.0 /100 | #335 | Tragic 1.3% |
| Nepalese | 0.0 /100 | #336 | Tragic 1.3% |
| Bangladeshis | 0.0 /100 | #337 | Tragic 1.2% |
| Puget Sound Salish | 0.0 /100 | #338 | Tragic 1.2% |
| Immigrants | Central America | 0.0 /100 | #339 | Tragic 1.2% |
| Immigrants | Cuba | 0.0 /100 | #340 | Tragic 1.2% |