Immigrants from Sri Lanka vs Immigrants from Philippines College, 1 year or more
COMPARE
Immigrants from Sri Lanka
Immigrants from Philippines
College, 1 year or more
College, 1 year or more Comparison
Immigrants from Sri Lanka
Immigrants from Philippines
65.4%
COLLEGE, 1 YEAR OR MORE
99.9/ 100
METRIC RATING
33rd/ 347
METRIC RANK
58.7%
COLLEGE, 1 YEAR OR MORE
29.2/ 100
METRIC RATING
191st/ 347
METRIC RANK
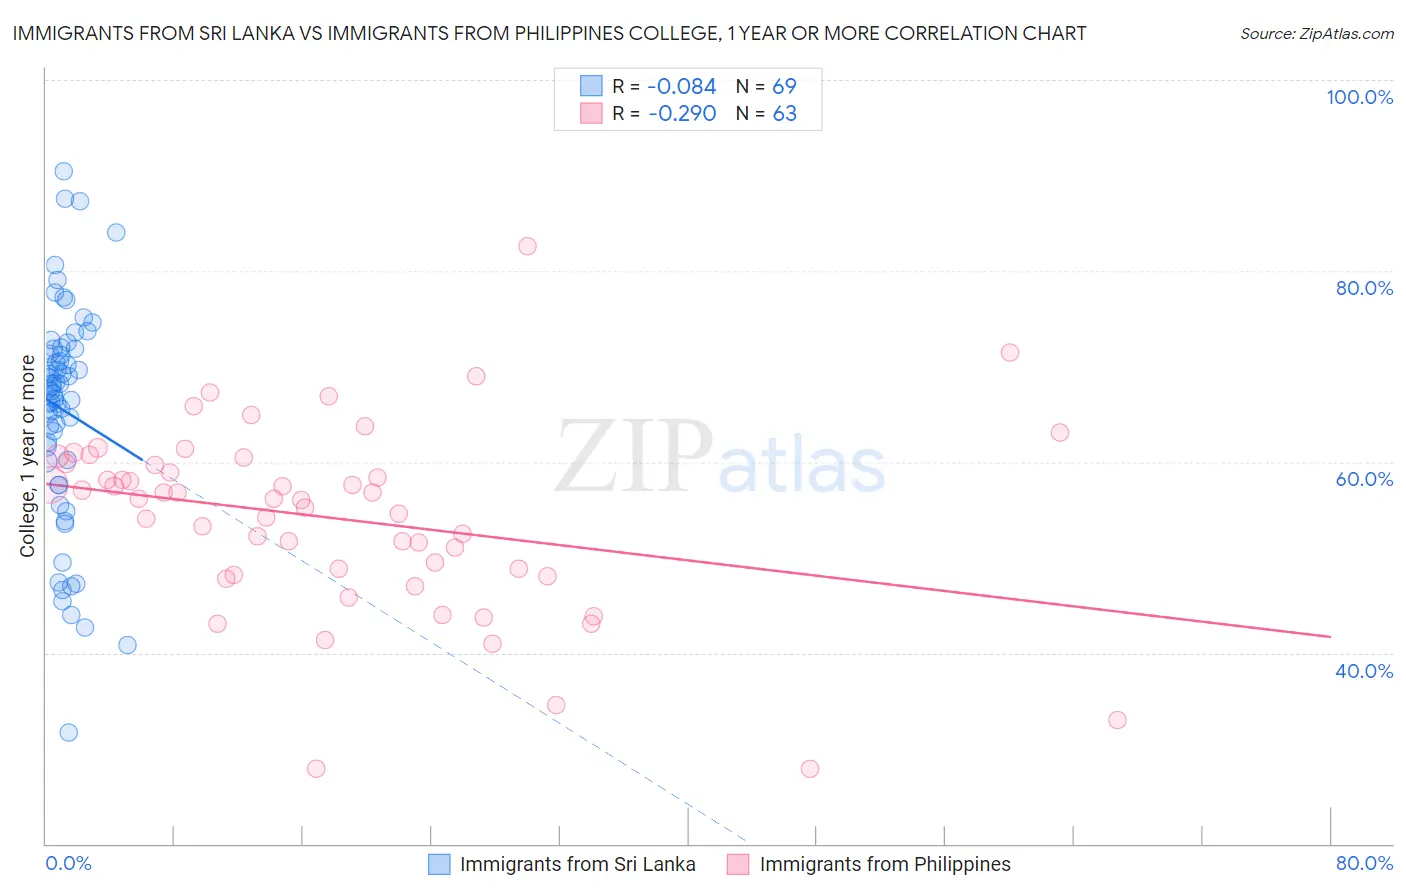
Immigrants from Sri Lanka vs Immigrants from Philippines College, 1 year or more Correlation Chart
The statistical analysis conducted on geographies consisting of 149,700,552 people shows a slight negative correlation between the proportion of Immigrants from Sri Lanka and percentage of population with at least college, 1 year or more education in the United States with a correlation coefficient (R) of -0.084 and weighted average of 65.4%. Similarly, the statistical analysis conducted on geographies consisting of 471,303,821 people shows a weak negative correlation between the proportion of Immigrants from Philippines and percentage of population with at least college, 1 year or more education in the United States with a correlation coefficient (R) of -0.290 and weighted average of 58.7%, a difference of 11.4%.
College, 1 year or more Correlation Summary
| Measurement | Immigrants from Sri Lanka | Immigrants from Philippines |
| Minimum | 31.7% | 27.9% |
| Maximum | 90.4% | 82.6% |
| Range | 58.7% | 54.7% |
| Mean | 65.4% | 54.1% |
| Median | 67.7% | 56.1% |
| Interquartile 25% (IQ1) | 60.1% | 48.1% |
| Interquartile 75% (IQ3) | 71.9% | 59.9% |
| Interquartile Range (IQR) | 11.8% | 11.7% |
| Standard Deviation (Sample) | 11.5% | 9.9% |
| Standard Deviation (Population) | 11.4% | 9.8% |
Similar Demographics by College, 1 year or more
Demographics Similar to Immigrants from Sri Lanka by College, 1 year or more
In terms of college, 1 year or more, the demographic groups most similar to Immigrants from Sri Lanka are Israeli (65.3%, a difference of 0.12%), Bulgarian (65.5%, a difference of 0.15%), Turkish (65.5%, a difference of 0.20%), Immigrants from Denmark (65.6%, a difference of 0.28%), and Immigrants from Turkey (65.2%, a difference of 0.32%).
| Demographics | Rating | Rank | College, 1 year or more |
| Latvians | 100.0 /100 | #26 | Exceptional 66.1% |
| Immigrants | Ireland | 100.0 /100 | #27 | Exceptional 65.9% |
| Immigrants | France | 100.0 /100 | #28 | Exceptional 65.8% |
| Immigrants | Northern Europe | 100.0 /100 | #29 | Exceptional 65.6% |
| Immigrants | Denmark | 100.0 /100 | #30 | Exceptional 65.6% |
| Turks | 100.0 /100 | #31 | Exceptional 65.5% |
| Bulgarians | 100.0 /100 | #32 | Exceptional 65.5% |
| Immigrants | Sri Lanka | 99.9 /100 | #33 | Exceptional 65.4% |
| Israelis | 99.9 /100 | #34 | Exceptional 65.3% |
| Immigrants | Turkey | 99.9 /100 | #35 | Exceptional 65.2% |
| Immigrants | South Africa | 99.9 /100 | #36 | Exceptional 65.1% |
| Russians | 99.9 /100 | #37 | Exceptional 65.1% |
| Immigrants | Saudi Arabia | 99.9 /100 | #38 | Exceptional 65.0% |
| Estonians | 99.9 /100 | #39 | Exceptional 65.0% |
| Immigrants | Kuwait | 99.9 /100 | #40 | Exceptional 65.0% |
Demographics Similar to Immigrants from Philippines by College, 1 year or more
In terms of college, 1 year or more, the demographic groups most similar to Immigrants from Philippines are Colombian (58.7%, a difference of 0.10%), Peruvian (58.6%, a difference of 0.11%), Immigrants from Cameroon (58.8%, a difference of 0.13%), Uruguayan (58.8%, a difference of 0.17%), and Costa Rican (58.6%, a difference of 0.18%).
| Demographics | Rating | Rank | College, 1 year or more |
| Spaniards | 38.3 /100 | #184 | Fair 59.0% |
| South Americans | 35.9 /100 | #185 | Fair 59.0% |
| Scotch-Irish | 34.7 /100 | #186 | Fair 58.9% |
| Germans | 34.7 /100 | #187 | Fair 58.9% |
| French | 34.4 /100 | #188 | Fair 58.9% |
| Uruguayans | 31.8 /100 | #189 | Fair 58.8% |
| Immigrants | Cameroon | 31.2 /100 | #190 | Fair 58.8% |
| Immigrants | Philippines | 29.2 /100 | #191 | Fair 58.7% |
| Colombians | 27.6 /100 | #192 | Fair 58.7% |
| Peruvians | 27.5 /100 | #193 | Fair 58.6% |
| Costa Ricans | 26.4 /100 | #194 | Fair 58.6% |
| Dutch | 26.2 /100 | #195 | Fair 58.6% |
| Guamanians/Chamorros | 26.2 /100 | #196 | Fair 58.6% |
| Immigrants | Thailand | 26.0 /100 | #197 | Fair 58.6% |
| Immigrants | South Eastern Asia | 25.1 /100 | #198 | Fair 58.5% |