European vs Immigrants from Philippines College, 1 year or more
COMPARE
European
Immigrants from Philippines
College, 1 year or more
College, 1 year or more Comparison
Europeans
Immigrants from Philippines
61.8%
COLLEGE, 1 YEAR OR MORE
95.6/ 100
METRIC RATING
110th/ 347
METRIC RANK
58.7%
COLLEGE, 1 YEAR OR MORE
29.2/ 100
METRIC RATING
191st/ 347
METRIC RANK
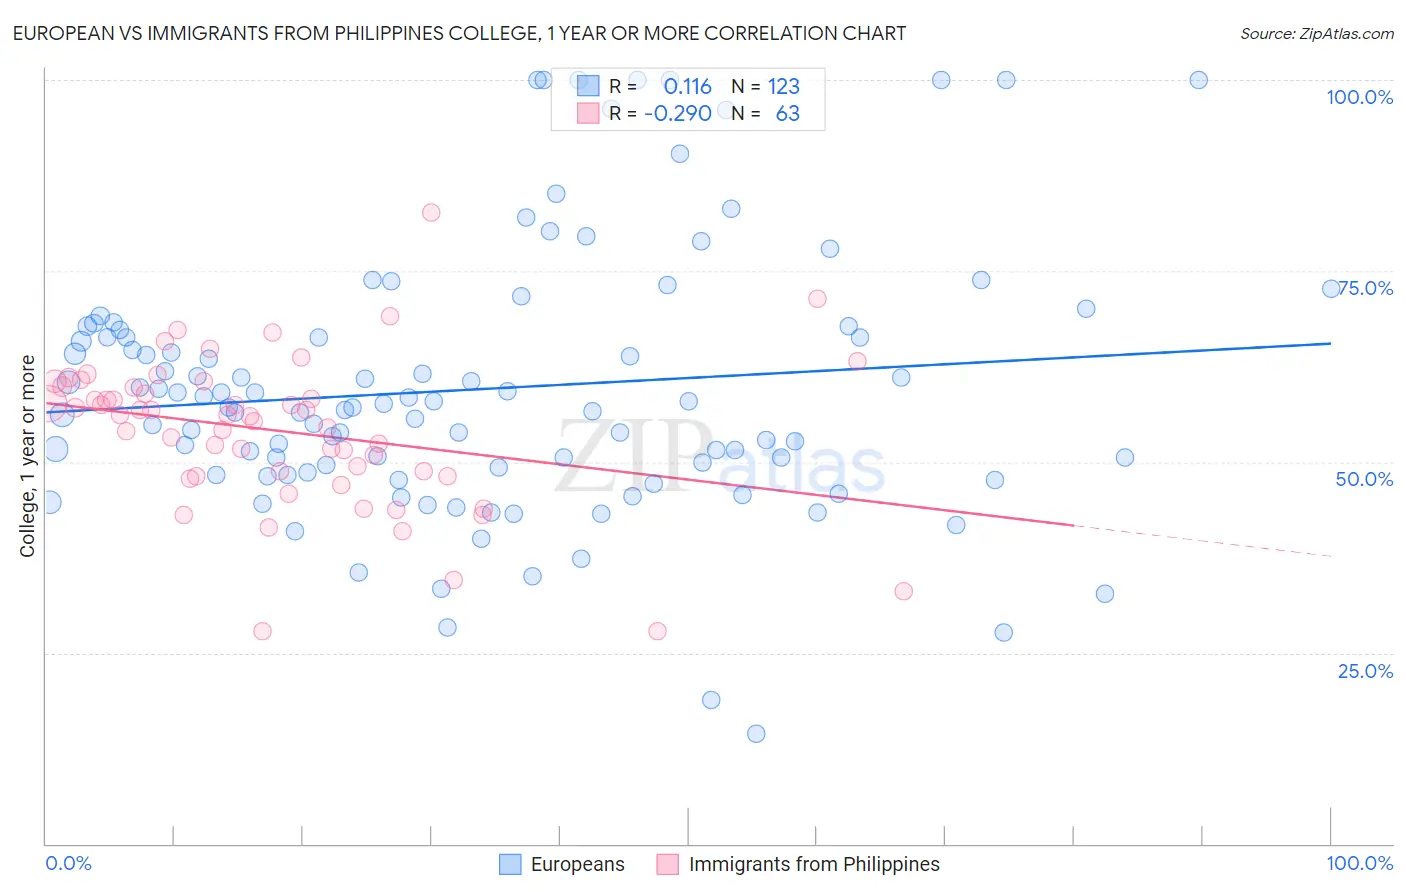
European vs Immigrants from Philippines College, 1 year or more Correlation Chart
The statistical analysis conducted on geographies consisting of 561,821,081 people shows a poor positive correlation between the proportion of Europeans and percentage of population with at least college, 1 year or more education in the United States with a correlation coefficient (R) of 0.116 and weighted average of 61.8%. Similarly, the statistical analysis conducted on geographies consisting of 471,303,821 people shows a weak negative correlation between the proportion of Immigrants from Philippines and percentage of population with at least college, 1 year or more education in the United States with a correlation coefficient (R) of -0.290 and weighted average of 58.7%, a difference of 5.3%.
College, 1 year or more Correlation Summary
| Measurement | European | Immigrants from Philippines |
| Minimum | 14.4% | 27.9% |
| Maximum | 100.0% | 82.6% |
| Range | 85.6% | 54.7% |
| Mean | 59.5% | 54.1% |
| Median | 57.2% | 56.1% |
| Interquartile 25% (IQ1) | 48.7% | 48.1% |
| Interquartile 75% (IQ3) | 67.3% | 59.9% |
| Interquartile Range (IQR) | 18.6% | 11.7% |
| Standard Deviation (Sample) | 17.4% | 9.9% |
| Standard Deviation (Population) | 17.3% | 9.8% |
Similar Demographics by College, 1 year or more
Demographics Similar to Europeans by College, 1 year or more
In terms of college, 1 year or more, the demographic groups most similar to Europeans are Macedonian (61.8%, a difference of 0.0%), Syrian (61.9%, a difference of 0.020%), Immigrants from Northern Africa (61.9%, a difference of 0.020%), Immigrants from Ukraine (61.9%, a difference of 0.040%), and Austrian (61.8%, a difference of 0.060%).
| Demographics | Rating | Rank | College, 1 year or more |
| Afghans | 96.4 /100 | #103 | Exceptional 62.0% |
| Chileans | 96.4 /100 | #104 | Exceptional 62.0% |
| Immigrants | Nepal | 96.3 /100 | #105 | Exceptional 62.0% |
| Palestinians | 96.3 /100 | #106 | Exceptional 62.0% |
| Immigrants | Ukraine | 95.8 /100 | #107 | Exceptional 61.9% |
| Syrians | 95.7 /100 | #108 | Exceptional 61.9% |
| Immigrants | Northern Africa | 95.7 /100 | #109 | Exceptional 61.9% |
| Europeans | 95.6 /100 | #110 | Exceptional 61.8% |
| Macedonians | 95.6 /100 | #111 | Exceptional 61.8% |
| Austrians | 95.4 /100 | #112 | Exceptional 61.8% |
| Ukrainians | 95.2 /100 | #113 | Exceptional 61.8% |
| Danes | 94.8 /100 | #114 | Exceptional 61.7% |
| Norwegians | 94.5 /100 | #115 | Exceptional 61.7% |
| Lebanese | 94.1 /100 | #116 | Exceptional 61.6% |
| Arabs | 93.9 /100 | #117 | Exceptional 61.6% |
Demographics Similar to Immigrants from Philippines by College, 1 year or more
In terms of college, 1 year or more, the demographic groups most similar to Immigrants from Philippines are Colombian (58.7%, a difference of 0.10%), Peruvian (58.6%, a difference of 0.11%), Immigrants from Cameroon (58.8%, a difference of 0.13%), Uruguayan (58.8%, a difference of 0.17%), and Costa Rican (58.6%, a difference of 0.18%).
| Demographics | Rating | Rank | College, 1 year or more |
| Spaniards | 38.3 /100 | #184 | Fair 59.0% |
| South Americans | 35.9 /100 | #185 | Fair 59.0% |
| Scotch-Irish | 34.7 /100 | #186 | Fair 58.9% |
| Germans | 34.7 /100 | #187 | Fair 58.9% |
| French | 34.4 /100 | #188 | Fair 58.9% |
| Uruguayans | 31.8 /100 | #189 | Fair 58.8% |
| Immigrants | Cameroon | 31.2 /100 | #190 | Fair 58.8% |
| Immigrants | Philippines | 29.2 /100 | #191 | Fair 58.7% |
| Colombians | 27.6 /100 | #192 | Fair 58.7% |
| Peruvians | 27.5 /100 | #193 | Fair 58.6% |
| Costa Ricans | 26.4 /100 | #194 | Fair 58.6% |
| Dutch | 26.2 /100 | #195 | Fair 58.6% |
| Guamanians/Chamorros | 26.2 /100 | #196 | Fair 58.6% |
| Immigrants | Thailand | 26.0 /100 | #197 | Fair 58.6% |
| Immigrants | South Eastern Asia | 25.1 /100 | #198 | Fair 58.5% |