Immigrants from the Azores vs Japanese 6th Grade
COMPARE
Immigrants from the Azores
Japanese
6th Grade
6th Grade Comparison
Immigrants from the Azores
Japanese
94.7%
6TH GRADE
0.0/ 100
METRIC RATING
334th/ 347
METRIC RANK
95.4%
6TH GRADE
0.0/ 100
METRIC RATING
316th/ 347
METRIC RANK
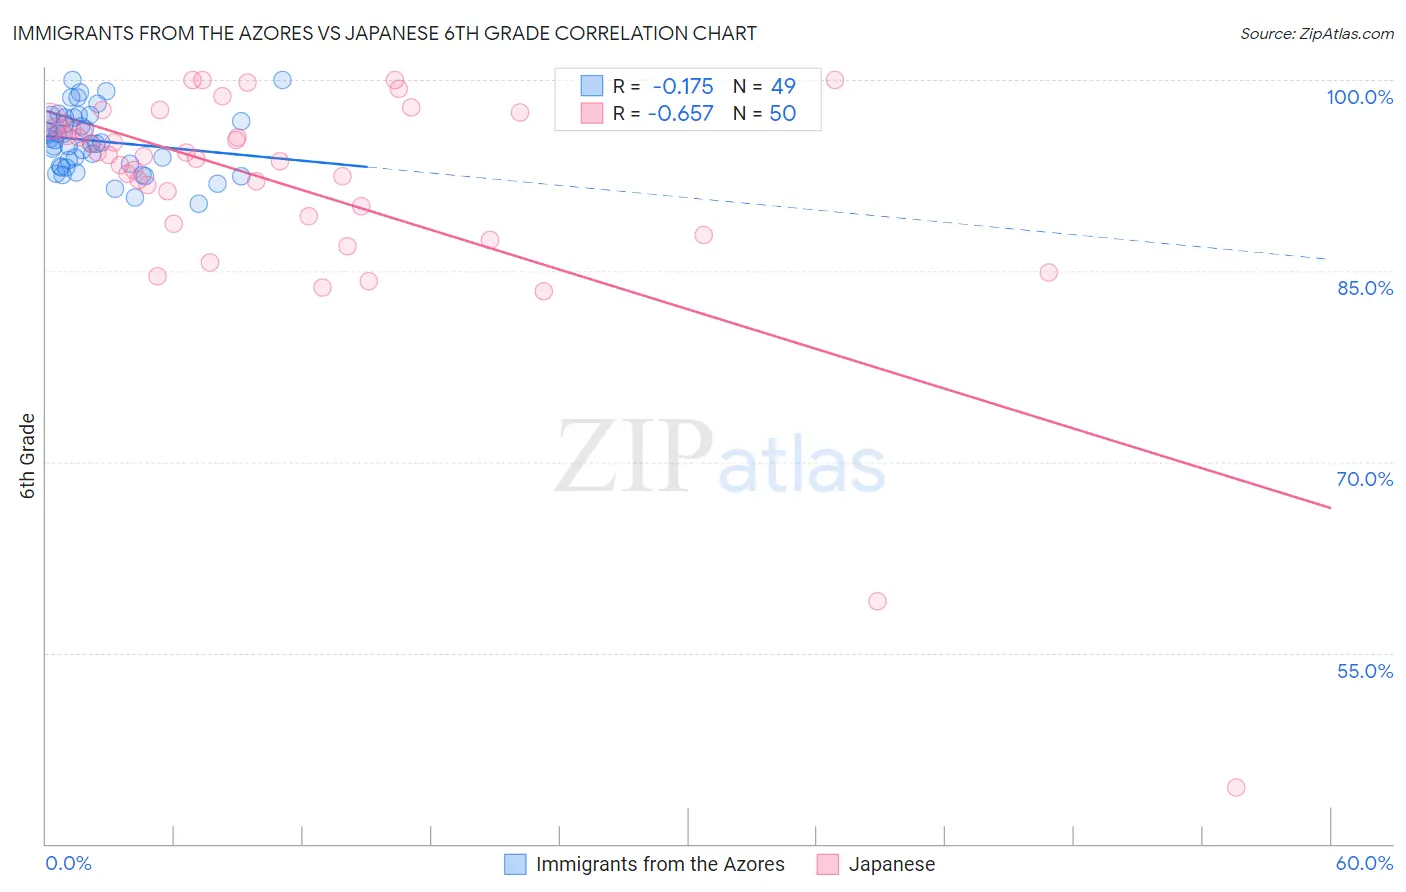
Immigrants from the Azores vs Japanese 6th Grade Correlation Chart
The statistical analysis conducted on geographies consisting of 46,257,310 people shows a poor negative correlation between the proportion of Immigrants from the Azores and percentage of population with at least 6th grade education in the United States with a correlation coefficient (R) of -0.175 and weighted average of 94.7%. Similarly, the statistical analysis conducted on geographies consisting of 249,183,224 people shows a significant negative correlation between the proportion of Japanese and percentage of population with at least 6th grade education in the United States with a correlation coefficient (R) of -0.657 and weighted average of 95.4%, a difference of 0.74%.
6th Grade Correlation Summary
| Measurement | Immigrants from the Azores | Japanese |
| Minimum | 90.3% | 44.4% |
| Maximum | 100.0% | 100.0% |
| Range | 9.7% | 55.6% |
| Mean | 95.2% | 91.7% |
| Median | 95.1% | 94.0% |
| Interquartile 25% (IQ1) | 93.2% | 89.3% |
| Interquartile 75% (IQ3) | 97.0% | 96.2% |
| Interquartile Range (IQR) | 3.8% | 6.9% |
| Standard Deviation (Sample) | 2.4% | 9.6% |
| Standard Deviation (Population) | 2.4% | 9.5% |
Demographics Similar to Immigrants from the Azores and Japanese by 6th Grade
In terms of 6th grade, the demographic groups most similar to Immigrants from the Azores are Immigrants from Latin America (94.7%, a difference of 0.020%), Mexican (94.6%, a difference of 0.020%), Immigrants from Honduras (94.8%, a difference of 0.10%), Immigrants from Armenia (94.9%, a difference of 0.20%), and Nepalese (94.9%, a difference of 0.22%). Similarly, the demographic groups most similar to Japanese are Immigrants from Bangladesh (95.4%, a difference of 0.010%), Vietnamese (95.3%, a difference of 0.030%), Belizean (95.3%, a difference of 0.060%), Immigrants from Belize (95.3%, a difference of 0.070%), and Immigrants from Ecuador (95.3%, a difference of 0.10%).
| Demographics | Rating | Rank | 6th Grade |
| Immigrants | Bangladesh | 0.0 /100 | #315 | Tragic 95.4% |
| Japanese | 0.0 /100 | #316 | Tragic 95.4% |
| Vietnamese | 0.0 /100 | #317 | Tragic 95.3% |
| Belizeans | 0.0 /100 | #318 | Tragic 95.3% |
| Immigrants | Belize | 0.0 /100 | #319 | Tragic 95.3% |
| Immigrants | Ecuador | 0.0 /100 | #320 | Tragic 95.3% |
| Immigrants | Fiji | 0.0 /100 | #321 | Tragic 95.2% |
| Immigrants | Cambodia | 0.0 /100 | #322 | Tragic 95.2% |
| Central American Indians | 0.0 /100 | #323 | Tragic 95.1% |
| Cape Verdeans | 0.0 /100 | #324 | Tragic 95.1% |
| Immigrants | Nicaragua | 0.0 /100 | #325 | Tragic 95.1% |
| Hispanics or Latinos | 0.0 /100 | #326 | Tragic 95.0% |
| Mexican American Indians | 0.0 /100 | #327 | Tragic 95.0% |
| Hondurans | 0.0 /100 | #328 | Tragic 95.0% |
| Dominicans | 0.0 /100 | #329 | Tragic 94.9% |
| Nepalese | 0.0 /100 | #330 | Tragic 94.9% |
| Immigrants | Armenia | 0.0 /100 | #331 | Tragic 94.9% |
| Immigrants | Honduras | 0.0 /100 | #332 | Tragic 94.8% |
| Immigrants | Latin America | 0.0 /100 | #333 | Tragic 94.7% |
| Immigrants | Azores | 0.0 /100 | #334 | Tragic 94.7% |
| Mexicans | 0.0 /100 | #335 | Tragic 94.6% |