Trinidadian and Tobagonian vs Thai Associate's Degree
COMPARE
Trinidadian and Tobagonian
Thai
Associate's Degree
Associate's Degree Comparison
Trinidadians and Tobagonians
Thais
43.6%
ASSOCIATE'S DEGREE
4.0/ 100
METRIC RATING
227th/ 347
METRIC RANK
57.4%
ASSOCIATE'S DEGREE
100.0/ 100
METRIC RATING
8th/ 347
METRIC RANK
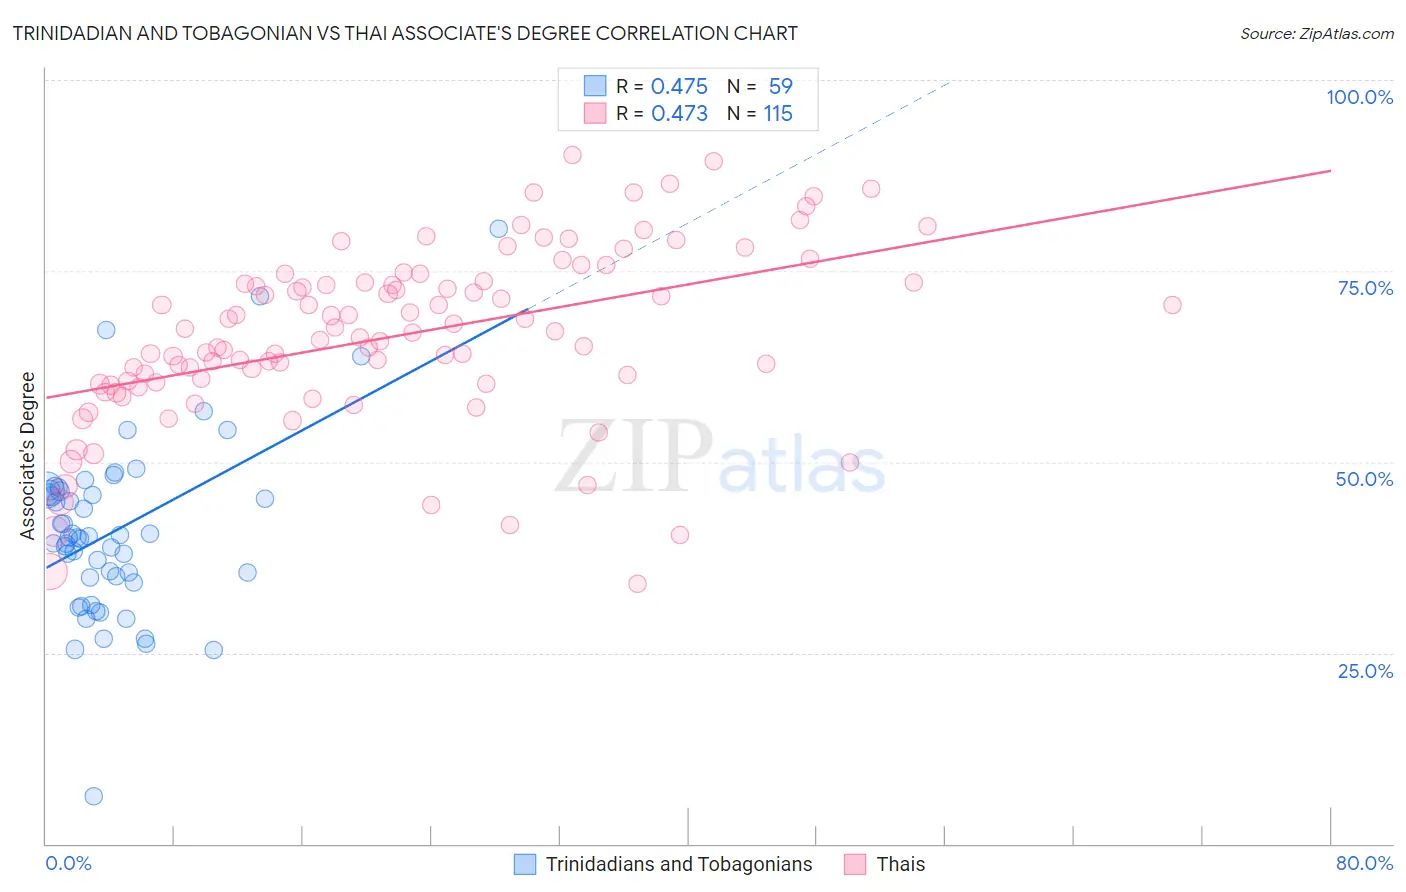
Trinidadian and Tobagonian vs Thai Associate's Degree Correlation Chart
The statistical analysis conducted on geographies consisting of 219,861,537 people shows a moderate positive correlation between the proportion of Trinidadians and Tobagonians and percentage of population with at least associate's degree education in the United States with a correlation coefficient (R) of 0.475 and weighted average of 43.6%. Similarly, the statistical analysis conducted on geographies consisting of 475,760,266 people shows a moderate positive correlation between the proportion of Thais and percentage of population with at least associate's degree education in the United States with a correlation coefficient (R) of 0.473 and weighted average of 57.4%, a difference of 31.7%.
Associate's Degree Correlation Summary
| Measurement | Trinidadian and Tobagonian | Thai |
| Minimum | 6.2% | 34.0% |
| Maximum | 80.5% | 90.2% |
| Range | 74.4% | 56.3% |
| Mean | 41.1% | 66.5% |
| Median | 40.2% | 66.9% |
| Interquartile 25% (IQ1) | 34.9% | 60.1% |
| Interquartile 75% (IQ3) | 46.3% | 73.5% |
| Interquartile Range (IQR) | 11.4% | 13.3% |
| Standard Deviation (Sample) | 11.9% | 11.4% |
| Standard Deviation (Population) | 11.8% | 11.4% |
Similar Demographics by Associate's Degree
Demographics Similar to Trinidadians and Tobagonians by Associate's Degree
In terms of associate's degree, the demographic groups most similar to Trinidadians and Tobagonians are Immigrants from Burma/Myanmar (43.7%, a difference of 0.17%), Guamanian/Chamorro (43.8%, a difference of 0.39%), Hmong (43.4%, a difference of 0.44%), West Indian (43.8%, a difference of 0.54%), and Immigrants from Trinidad and Tobago (43.3%, a difference of 0.60%).
| Demographics | Rating | Rank | Associate's Degree |
| Portuguese | 7.2 /100 | #220 | Tragic 44.1% |
| Immigrants | Western Africa | 6.6 /100 | #221 | Tragic 44.1% |
| Barbadians | 5.8 /100 | #222 | Tragic 43.9% |
| Sub-Saharan Africans | 5.5 /100 | #223 | Tragic 43.9% |
| West Indians | 5.2 /100 | #224 | Tragic 43.8% |
| Guamanians/Chamorros | 4.8 /100 | #225 | Tragic 43.8% |
| Immigrants | Burma/Myanmar | 4.3 /100 | #226 | Tragic 43.7% |
| Trinidadians and Tobagonians | 4.0 /100 | #227 | Tragic 43.6% |
| Hmong | 3.2 /100 | #228 | Tragic 43.4% |
| Immigrants | Trinidad and Tobago | 3.0 /100 | #229 | Tragic 43.3% |
| Immigrants | Barbados | 2.9 /100 | #230 | Tragic 43.3% |
| Liberians | 2.9 /100 | #231 | Tragic 43.3% |
| Native Hawaiians | 2.3 /100 | #232 | Tragic 43.1% |
| Tongans | 2.2 /100 | #233 | Tragic 43.0% |
| Tlingit-Haida | 2.1 /100 | #234 | Tragic 43.0% |
Demographics Similar to Thais by Associate's Degree
In terms of associate's degree, the demographic groups most similar to Thais are Immigrants from Iran (57.7%, a difference of 0.40%), Okinawan (57.7%, a difference of 0.46%), Immigrants from Israel (56.8%, a difference of 1.1%), Iranian (58.2%, a difference of 1.3%), and Immigrants from Taiwan (58.4%, a difference of 1.7%).
| Demographics | Rating | Rank | Associate's Degree |
| Filipinos | 100.0 /100 | #1 | Exceptional 59.8% |
| Immigrants | Singapore | 100.0 /100 | #2 | Exceptional 58.9% |
| Immigrants | India | 100.0 /100 | #3 | Exceptional 58.5% |
| Immigrants | Taiwan | 100.0 /100 | #4 | Exceptional 58.4% |
| Iranians | 100.0 /100 | #5 | Exceptional 58.2% |
| Okinawans | 100.0 /100 | #6 | Exceptional 57.7% |
| Immigrants | Iran | 100.0 /100 | #7 | Exceptional 57.7% |
| Thais | 100.0 /100 | #8 | Exceptional 57.4% |
| Immigrants | Israel | 100.0 /100 | #9 | Exceptional 56.8% |
| Cypriots | 100.0 /100 | #10 | Exceptional 56.4% |
| Immigrants | Australia | 100.0 /100 | #11 | Exceptional 55.8% |
| Immigrants | South Central Asia | 100.0 /100 | #12 | Exceptional 55.7% |
| Immigrants | China | 100.0 /100 | #13 | Exceptional 55.5% |
| Immigrants | Hong Kong | 100.0 /100 | #14 | Exceptional 55.4% |
| Immigrants | Eastern Asia | 100.0 /100 | #15 | Exceptional 55.4% |