Trinidadian and Tobagonian vs Yuman Associate's Degree
COMPARE
Trinidadian and Tobagonian
Yuman
Associate's Degree
Associate's Degree Comparison
Trinidadians and Tobagonians
Yuman
43.6%
ASSOCIATE'S DEGREE
4.0/ 100
METRIC RATING
227th/ 347
METRIC RANK
31.3%
ASSOCIATE'S DEGREE
0.0/ 100
METRIC RATING
344th/ 347
METRIC RANK
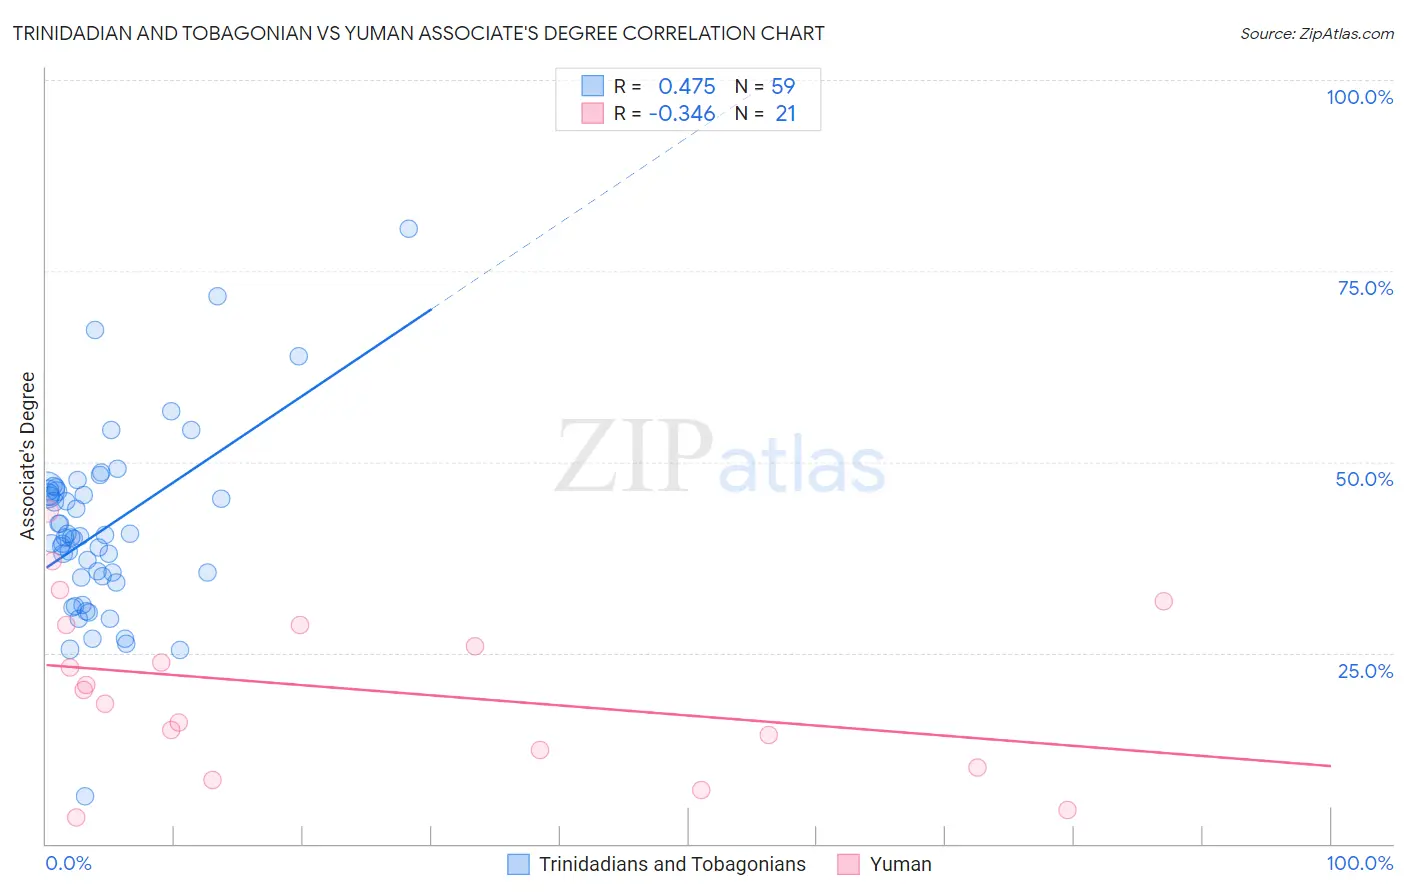
Trinidadian and Tobagonian vs Yuman Associate's Degree Correlation Chart
The statistical analysis conducted on geographies consisting of 219,861,537 people shows a moderate positive correlation between the proportion of Trinidadians and Tobagonians and percentage of population with at least associate's degree education in the United States with a correlation coefficient (R) of 0.475 and weighted average of 43.6%. Similarly, the statistical analysis conducted on geographies consisting of 40,695,957 people shows a mild negative correlation between the proportion of Yuman and percentage of population with at least associate's degree education in the United States with a correlation coefficient (R) of -0.346 and weighted average of 31.3%, a difference of 39.5%.
Associate's Degree Correlation Summary
| Measurement | Trinidadian and Tobagonian | Yuman |
| Minimum | 6.2% | 3.5% |
| Maximum | 80.5% | 43.6% |
| Range | 74.4% | 40.1% |
| Mean | 41.1% | 20.3% |
| Median | 40.2% | 20.2% |
| Interquartile 25% (IQ1) | 34.9% | 11.1% |
| Interquartile 75% (IQ3) | 46.3% | 28.7% |
| Interquartile Range (IQR) | 11.4% | 17.6% |
| Standard Deviation (Sample) | 11.9% | 11.0% |
| Standard Deviation (Population) | 11.8% | 10.8% |
Similar Demographics by Associate's Degree
Demographics Similar to Trinidadians and Tobagonians by Associate's Degree
In terms of associate's degree, the demographic groups most similar to Trinidadians and Tobagonians are Immigrants from Burma/Myanmar (43.7%, a difference of 0.17%), Guamanian/Chamorro (43.8%, a difference of 0.39%), Hmong (43.4%, a difference of 0.44%), West Indian (43.8%, a difference of 0.54%), and Immigrants from Trinidad and Tobago (43.3%, a difference of 0.60%).
| Demographics | Rating | Rank | Associate's Degree |
| Portuguese | 7.2 /100 | #220 | Tragic 44.1% |
| Immigrants | Western Africa | 6.6 /100 | #221 | Tragic 44.1% |
| Barbadians | 5.8 /100 | #222 | Tragic 43.9% |
| Sub-Saharan Africans | 5.5 /100 | #223 | Tragic 43.9% |
| West Indians | 5.2 /100 | #224 | Tragic 43.8% |
| Guamanians/Chamorros | 4.8 /100 | #225 | Tragic 43.8% |
| Immigrants | Burma/Myanmar | 4.3 /100 | #226 | Tragic 43.7% |
| Trinidadians and Tobagonians | 4.0 /100 | #227 | Tragic 43.6% |
| Hmong | 3.2 /100 | #228 | Tragic 43.4% |
| Immigrants | Trinidad and Tobago | 3.0 /100 | #229 | Tragic 43.3% |
| Immigrants | Barbados | 2.9 /100 | #230 | Tragic 43.3% |
| Liberians | 2.9 /100 | #231 | Tragic 43.3% |
| Native Hawaiians | 2.3 /100 | #232 | Tragic 43.1% |
| Tongans | 2.2 /100 | #233 | Tragic 43.0% |
| Tlingit-Haida | 2.1 /100 | #234 | Tragic 43.0% |
Demographics Similar to Yuman by Associate's Degree
In terms of associate's degree, the demographic groups most similar to Yuman are Tohono O'odham (31.8%, a difference of 1.7%), Yakama (32.3%, a difference of 3.4%), Pima (30.2%, a difference of 3.4%), Inupiat (32.6%, a difference of 4.2%), and Navajo (32.6%, a difference of 4.3%).
| Demographics | Rating | Rank | Associate's Degree |
| Mexicans | 0.0 /100 | #333 | Tragic 35.0% |
| Natives/Alaskans | 0.0 /100 | #334 | Tragic 34.9% |
| Spanish American Indians | 0.0 /100 | #335 | Tragic 34.9% |
| Hopi | 0.0 /100 | #336 | Tragic 34.6% |
| Lumbee | 0.0 /100 | #337 | Tragic 34.1% |
| Pueblo | 0.0 /100 | #338 | Tragic 34.0% |
| Immigrants | Mexico | 0.0 /100 | #339 | Tragic 33.7% |
| Navajo | 0.0 /100 | #340 | Tragic 32.6% |
| Inupiat | 0.0 /100 | #341 | Tragic 32.6% |
| Yakama | 0.0 /100 | #342 | Tragic 32.3% |
| Tohono O'odham | 0.0 /100 | #343 | Tragic 31.8% |
| Yuman | 0.0 /100 | #344 | Tragic 31.3% |
| Pima | 0.0 /100 | #345 | Tragic 30.2% |
| Houma | 0.0 /100 | #346 | Tragic 28.2% |
| Yup'ik | 0.0 /100 | #347 | Tragic 25.0% |