Tongan vs Immigrants from Guyana 9th Grade
COMPARE
Tongan
Immigrants from Guyana
9th Grade
9th Grade Comparison
Tongans
Immigrants from Guyana
94.4%
9TH GRADE
6.0/ 100
METRIC RATING
224th/ 347
METRIC RANK
92.5%
9TH GRADE
0.0/ 100
METRIC RATING
308th/ 347
METRIC RANK
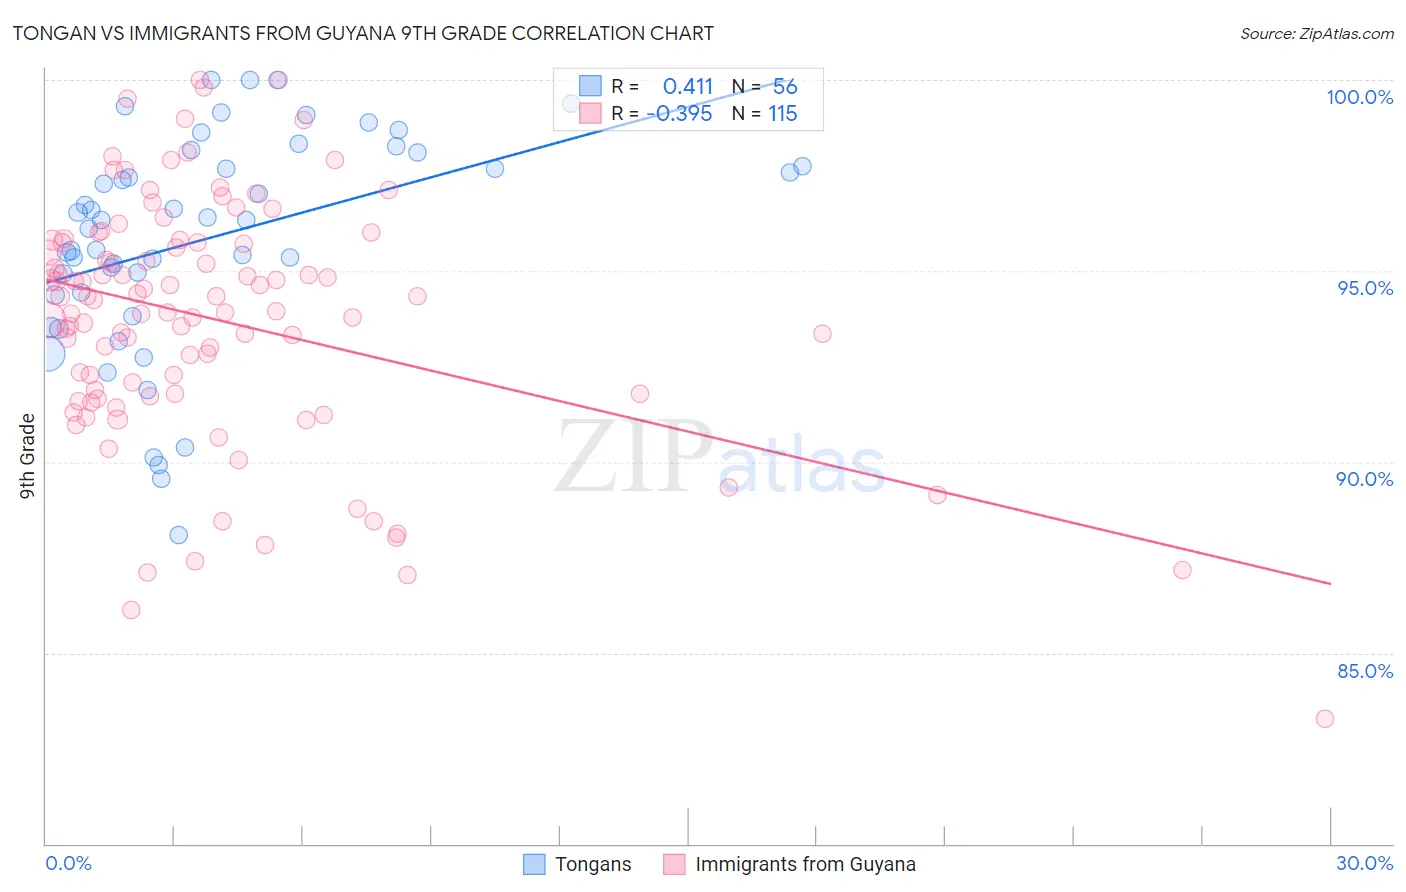
Tongan vs Immigrants from Guyana 9th Grade Correlation Chart
The statistical analysis conducted on geographies consisting of 102,873,790 people shows a moderate positive correlation between the proportion of Tongans and percentage of population with at least 9th grade education in the United States with a correlation coefficient (R) of 0.411 and weighted average of 94.4%. Similarly, the statistical analysis conducted on geographies consisting of 183,673,461 people shows a mild negative correlation between the proportion of Immigrants from Guyana and percentage of population with at least 9th grade education in the United States with a correlation coefficient (R) of -0.395 and weighted average of 92.5%, a difference of 2.0%.
9th Grade Correlation Summary
| Measurement | Tongan | Immigrants from Guyana |
| Minimum | 88.1% | 83.3% |
| Maximum | 100.0% | 100.0% |
| Range | 11.9% | 16.7% |
| Mean | 95.8% | 93.7% |
| Median | 96.3% | 94.3% |
| Interquartile 25% (IQ1) | 94.4% | 91.8% |
| Interquartile 75% (IQ3) | 97.9% | 95.7% |
| Interquartile Range (IQR) | 3.5% | 4.0% |
| Standard Deviation (Sample) | 2.8% | 3.2% |
| Standard Deviation (Population) | 2.8% | 3.2% |
Similar Demographics by 9th Grade
Demographics Similar to Tongans by 9th Grade
In terms of 9th grade, the demographic groups most similar to Tongans are Ethiopian (94.4%, a difference of 0.020%), Subsaharan African (94.4%, a difference of 0.020%), Bahamian (94.4%, a difference of 0.030%), Immigrants from Sierra Leone (94.4%, a difference of 0.040%), and Immigrants from Asia (94.4%, a difference of 0.050%).
| Demographics | Rating | Rank | 9th Grade |
| Asians | 9.9 /100 | #217 | Tragic 94.5% |
| Portuguese | 9.2 /100 | #218 | Tragic 94.5% |
| Africans | 9.0 /100 | #219 | Tragic 94.5% |
| Indians (Asian) | 8.6 /100 | #220 | Tragic 94.5% |
| Immigrants | Eastern Africa | 8.2 /100 | #221 | Tragic 94.5% |
| Immigrants | Asia | 7.7 /100 | #222 | Tragic 94.4% |
| Bahamians | 7.0 /100 | #223 | Tragic 94.4% |
| Tongans | 6.0 /100 | #224 | Tragic 94.4% |
| Ethiopians | 5.4 /100 | #225 | Tragic 94.4% |
| Sub-Saharan Africans | 5.4 /100 | #226 | Tragic 94.4% |
| Immigrants | Sierra Leone | 4.8 /100 | #227 | Tragic 94.4% |
| Lumbee | 4.7 /100 | #228 | Tragic 94.4% |
| Immigrants | Southern Europe | 4.5 /100 | #229 | Tragic 94.3% |
| Apache | 4.2 /100 | #230 | Tragic 94.3% |
| Immigrants | Panama | 4.0 /100 | #231 | Tragic 94.3% |
Demographics Similar to Immigrants from Guyana by 9th Grade
In terms of 9th grade, the demographic groups most similar to Immigrants from Guyana are Immigrants (92.5%, a difference of 0.010%), Japanese (92.6%, a difference of 0.11%), Immigrants from Vietnam (92.6%, a difference of 0.11%), Tohono O'odham (92.6%, a difference of 0.13%), and Guyanese (92.7%, a difference of 0.15%).
| Demographics | Rating | Rank | 9th Grade |
| Immigrants | Haiti | 0.0 /100 | #301 | Tragic 92.7% |
| Immigrants | Dominica | 0.0 /100 | #302 | Tragic 92.7% |
| Guyanese | 0.0 /100 | #303 | Tragic 92.7% |
| Tohono O'odham | 0.0 /100 | #304 | Tragic 92.6% |
| Japanese | 0.0 /100 | #305 | Tragic 92.6% |
| Immigrants | Vietnam | 0.0 /100 | #306 | Tragic 92.6% |
| Immigrants | Immigrants | 0.0 /100 | #307 | Tragic 92.5% |
| Immigrants | Guyana | 0.0 /100 | #308 | Tragic 92.5% |
| Immigrants | Bangladesh | 0.0 /100 | #309 | Tragic 92.4% |
| Immigrants | Cambodia | 0.0 /100 | #310 | Tragic 92.4% |
| Immigrants | Fiji | 0.0 /100 | #311 | Tragic 92.3% |
| Houma | 0.0 /100 | #312 | Tragic 92.3% |
| Vietnamese | 0.0 /100 | #313 | Tragic 92.3% |
| Immigrants | Portugal | 0.0 /100 | #314 | Tragic 92.2% |
| Immigrants | Caribbean | 0.0 /100 | #315 | Tragic 92.2% |