Tongan vs British West Indian 9th Grade
COMPARE
Tongan
British West Indian
9th Grade
9th Grade Comparison
Tongans
British West Indians
94.4%
9TH GRADE
6.0/ 100
METRIC RATING
224th/ 347
METRIC RANK
93.2%
9TH GRADE
0.0/ 100
METRIC RATING
291st/ 347
METRIC RANK
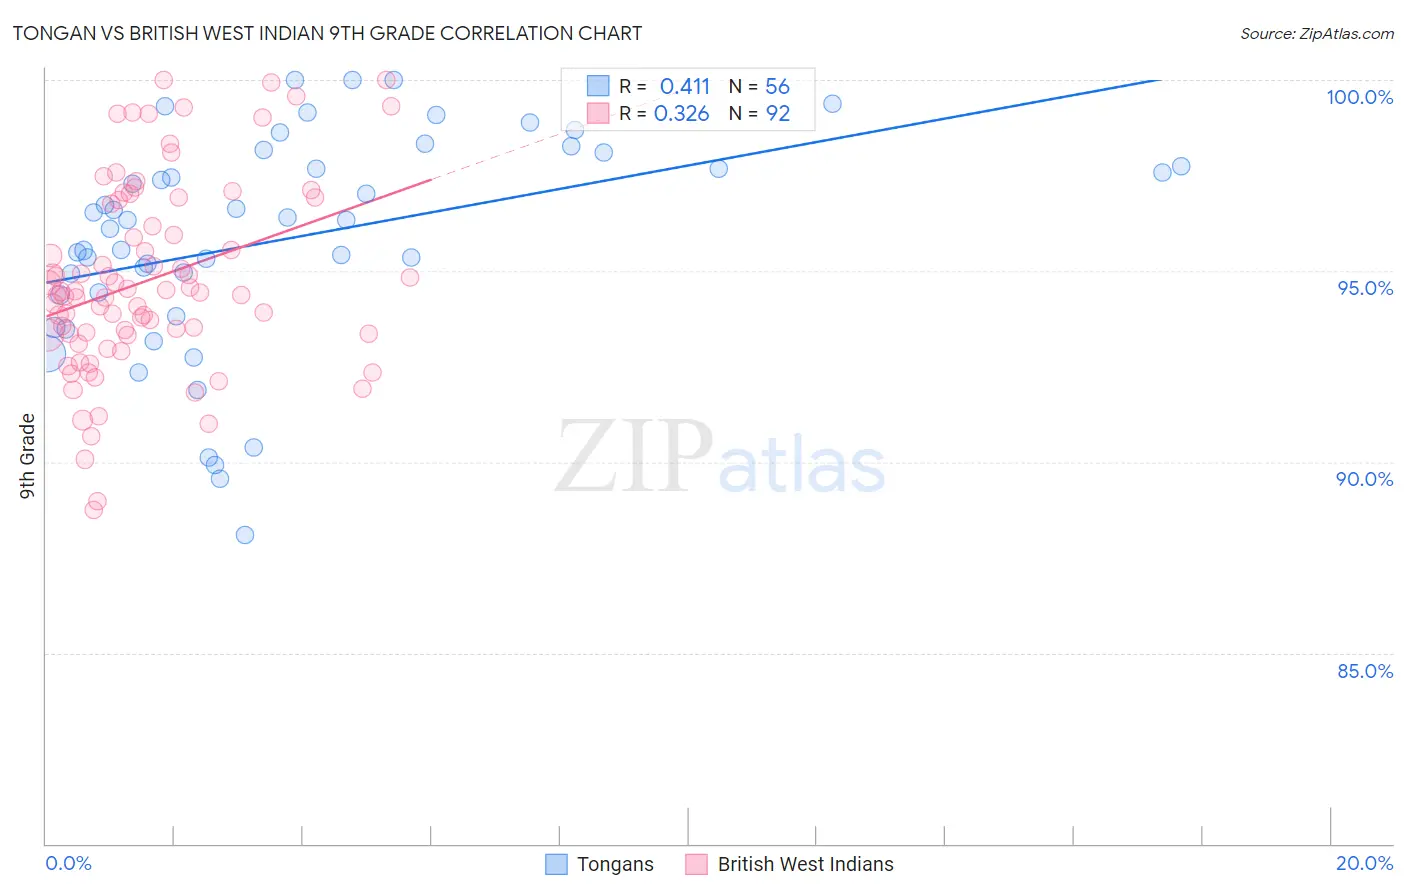
Tongan vs British West Indian 9th Grade Correlation Chart
The statistical analysis conducted on geographies consisting of 102,873,790 people shows a moderate positive correlation between the proportion of Tongans and percentage of population with at least 9th grade education in the United States with a correlation coefficient (R) of 0.411 and weighted average of 94.4%. Similarly, the statistical analysis conducted on geographies consisting of 152,691,173 people shows a mild positive correlation between the proportion of British West Indians and percentage of population with at least 9th grade education in the United States with a correlation coefficient (R) of 0.326 and weighted average of 93.2%, a difference of 1.3%.
9th Grade Correlation Summary
| Measurement | Tongan | British West Indian |
| Minimum | 88.1% | 88.8% |
| Maximum | 100.0% | 100.0% |
| Range | 11.9% | 11.2% |
| Mean | 95.8% | 94.8% |
| Median | 96.3% | 94.4% |
| Interquartile 25% (IQ1) | 94.4% | 93.3% |
| Interquartile 75% (IQ3) | 97.9% | 96.8% |
| Interquartile Range (IQR) | 3.5% | 3.5% |
| Standard Deviation (Sample) | 2.8% | 2.5% |
| Standard Deviation (Population) | 2.8% | 2.5% |
Similar Demographics by 9th Grade
Demographics Similar to Tongans by 9th Grade
In terms of 9th grade, the demographic groups most similar to Tongans are Ethiopian (94.4%, a difference of 0.020%), Subsaharan African (94.4%, a difference of 0.020%), Bahamian (94.4%, a difference of 0.030%), Immigrants from Sierra Leone (94.4%, a difference of 0.040%), and Immigrants from Asia (94.4%, a difference of 0.050%).
| Demographics | Rating | Rank | 9th Grade |
| Asians | 9.9 /100 | #217 | Tragic 94.5% |
| Portuguese | 9.2 /100 | #218 | Tragic 94.5% |
| Africans | 9.0 /100 | #219 | Tragic 94.5% |
| Indians (Asian) | 8.6 /100 | #220 | Tragic 94.5% |
| Immigrants | Eastern Africa | 8.2 /100 | #221 | Tragic 94.5% |
| Immigrants | Asia | 7.7 /100 | #222 | Tragic 94.4% |
| Bahamians | 7.0 /100 | #223 | Tragic 94.4% |
| Tongans | 6.0 /100 | #224 | Tragic 94.4% |
| Ethiopians | 5.4 /100 | #225 | Tragic 94.4% |
| Sub-Saharan Africans | 5.4 /100 | #226 | Tragic 94.4% |
| Immigrants | Sierra Leone | 4.8 /100 | #227 | Tragic 94.4% |
| Lumbee | 4.7 /100 | #228 | Tragic 94.4% |
| Immigrants | Southern Europe | 4.5 /100 | #229 | Tragic 94.3% |
| Apache | 4.2 /100 | #230 | Tragic 94.3% |
| Immigrants | Panama | 4.0 /100 | #231 | Tragic 94.3% |
Demographics Similar to British West Indians by 9th Grade
In terms of 9th grade, the demographic groups most similar to British West Indians are Immigrants from Laos (93.2%, a difference of 0.020%), Sri Lankan (93.2%, a difference of 0.030%), Cuban (93.2%, a difference of 0.030%), Immigrants from Burma/Myanmar (93.1%, a difference of 0.050%), and Indonesian (93.1%, a difference of 0.060%).
| Demographics | Rating | Rank | 9th Grade |
| Bangladeshis | 0.0 /100 | #284 | Tragic 93.4% |
| Immigrants | Peru | 0.0 /100 | #285 | Tragic 93.4% |
| Immigrants | Barbados | 0.0 /100 | #286 | Tragic 93.4% |
| Immigrants | St. Vincent and the Grenadines | 0.0 /100 | #287 | Tragic 93.4% |
| Immigrants | South Eastern Asia | 0.0 /100 | #288 | Tragic 93.3% |
| Immigrants | West Indies | 0.0 /100 | #289 | Tragic 93.3% |
| Pennsylvania Germans | 0.0 /100 | #290 | Tragic 93.3% |
| British West Indians | 0.0 /100 | #291 | Tragic 93.2% |
| Immigrants | Laos | 0.0 /100 | #292 | Tragic 93.2% |
| Sri Lankans | 0.0 /100 | #293 | Tragic 93.2% |
| Cubans | 0.0 /100 | #294 | Tragic 93.2% |
| Immigrants | Burma/Myanmar | 0.0 /100 | #295 | Tragic 93.1% |
| Indonesians | 0.0 /100 | #296 | Tragic 93.1% |
| Fijians | 0.0 /100 | #297 | Tragic 93.1% |
| Haitians | 0.0 /100 | #298 | Tragic 93.1% |