Tongan vs Immigrants from Guyana Householder Income Under 25 years
COMPARE
Tongan
Immigrants from Guyana
Householder Income Under 25 years
Householder Income Under 25 years Comparison
Tongans
Immigrants from Guyana
$56,972
HOUSEHOLDER INCOME UNDER 25 YEARS
100.0/ 100
METRIC RATING
23rd/ 347
METRIC RANK
$55,726
HOUSEHOLDER INCOME UNDER 25 YEARS
100.0/ 100
METRIC RATING
41st/ 347
METRIC RANK
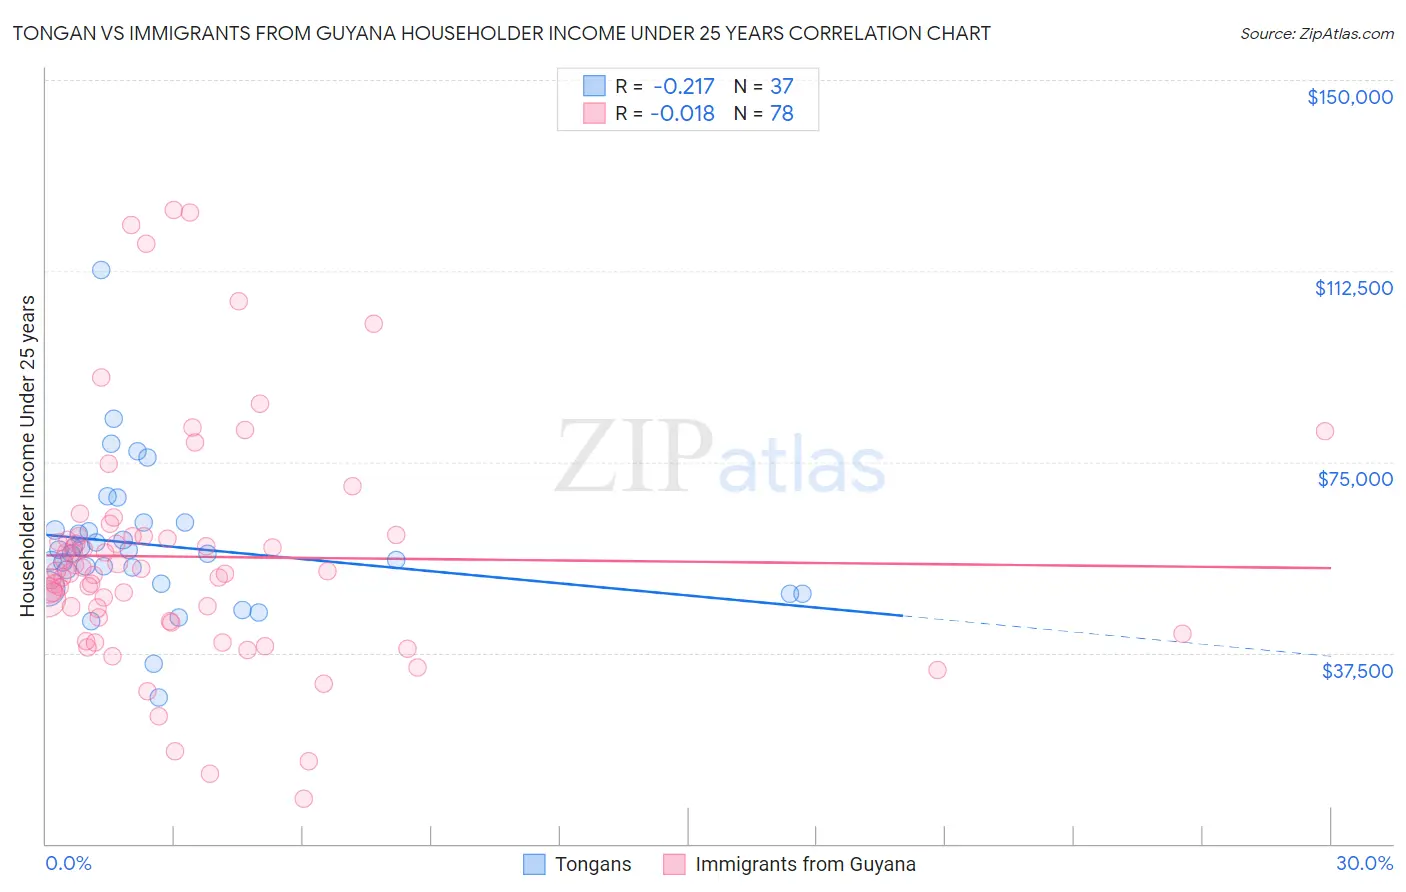
Tongan vs Immigrants from Guyana Householder Income Under 25 years Correlation Chart
The statistical analysis conducted on geographies consisting of 96,005,188 people shows a weak negative correlation between the proportion of Tongans and household income with householder under the age of 25 in the United States with a correlation coefficient (R) of -0.217 and weighted average of $56,972. Similarly, the statistical analysis conducted on geographies consisting of 159,030,692 people shows no correlation between the proportion of Immigrants from Guyana and household income with householder under the age of 25 in the United States with a correlation coefficient (R) of -0.018 and weighted average of $55,726, a difference of 2.2%.
Householder Income Under 25 years Correlation Summary
| Measurement | Tongan | Immigrants from Guyana |
| Minimum | $28,696 | $8,838 |
| Maximum | $112,736 | $124,392 |
| Range | $84,040 | $115,554 |
| Mean | $58,510 | $56,359 |
| Median | $56,941 | $53,366 |
| Interquartile 25% (IQ1) | $50,618 | $43,724 |
| Interquartile 75% (IQ3) | $62,342 | $60,316 |
| Interquartile Range (IQR) | $11,724 | $16,592 |
| Standard Deviation (Sample) | $14,382 | $23,247 |
| Standard Deviation (Population) | $14,186 | $23,098 |
Demographics Similar to Tongans and Immigrants from Guyana by Householder Income Under 25 years
In terms of householder income under 25 years, the demographic groups most similar to Tongans are Asian ($57,003, a difference of 0.050%), Immigrants from Singapore ($56,835, a difference of 0.24%), Immigrants from Pakistan ($56,789, a difference of 0.32%), Immigrants from Australia ($56,660, a difference of 0.55%), and Immigrants from North Macedonia ($56,503, a difference of 0.83%). Similarly, the demographic groups most similar to Immigrants from Guyana are Immigrants from Greece ($55,727, a difference of 0.0%), Immigrants from Korea ($55,716, a difference of 0.020%), Immigrants from Belarus ($55,743, a difference of 0.030%), Immigrants from Iran ($55,880, a difference of 0.28%), and Immigrants from Russia ($55,891, a difference of 0.30%).
| Demographics | Rating | Rank | Householder Income Under 25 years |
| Asians | 100.0 /100 | #22 | Exceptional $57,003 |
| Tongans | 100.0 /100 | #23 | Exceptional $56,972 |
| Immigrants | Singapore | 100.0 /100 | #24 | Exceptional $56,835 |
| Immigrants | Pakistan | 100.0 /100 | #25 | Exceptional $56,789 |
| Immigrants | Australia | 100.0 /100 | #26 | Exceptional $56,660 |
| Immigrants | North Macedonia | 100.0 /100 | #27 | Exceptional $56,503 |
| Immigrants | Peru | 100.0 /100 | #28 | Exceptional $56,384 |
| Immigrants | Asia | 100.0 /100 | #29 | Exceptional $56,379 |
| Immigrants | Moldova | 100.0 /100 | #30 | Exceptional $56,168 |
| Vietnamese | 100.0 /100 | #31 | Exceptional $56,127 |
| Peruvians | 100.0 /100 | #32 | Exceptional $56,052 |
| Inupiat | 100.0 /100 | #33 | Exceptional $55,935 |
| Immigrants | Japan | 100.0 /100 | #34 | Exceptional $55,932 |
| Tlingit-Haida | 100.0 /100 | #35 | Exceptional $55,914 |
| Immigrants | Israel | 100.0 /100 | #36 | Exceptional $55,913 |
| Immigrants | Russia | 100.0 /100 | #37 | Exceptional $55,891 |
| Immigrants | Iran | 100.0 /100 | #38 | Exceptional $55,880 |
| Immigrants | Belarus | 100.0 /100 | #39 | Exceptional $55,743 |
| Immigrants | Greece | 100.0 /100 | #40 | Exceptional $55,727 |
| Immigrants | Guyana | 100.0 /100 | #41 | Exceptional $55,726 |
| Immigrants | Korea | 100.0 /100 | #42 | Exceptional $55,716 |