Tongan vs Immigrants from Lithuania 9th Grade
COMPARE
Tongan
Immigrants from Lithuania
9th Grade
9th Grade Comparison
Tongans
Immigrants from Lithuania
94.4%
9TH GRADE
6.0/ 100
METRIC RATING
224th/ 347
METRIC RANK
95.8%
9TH GRADE
99.6/ 100
METRIC RATING
69th/ 347
METRIC RANK
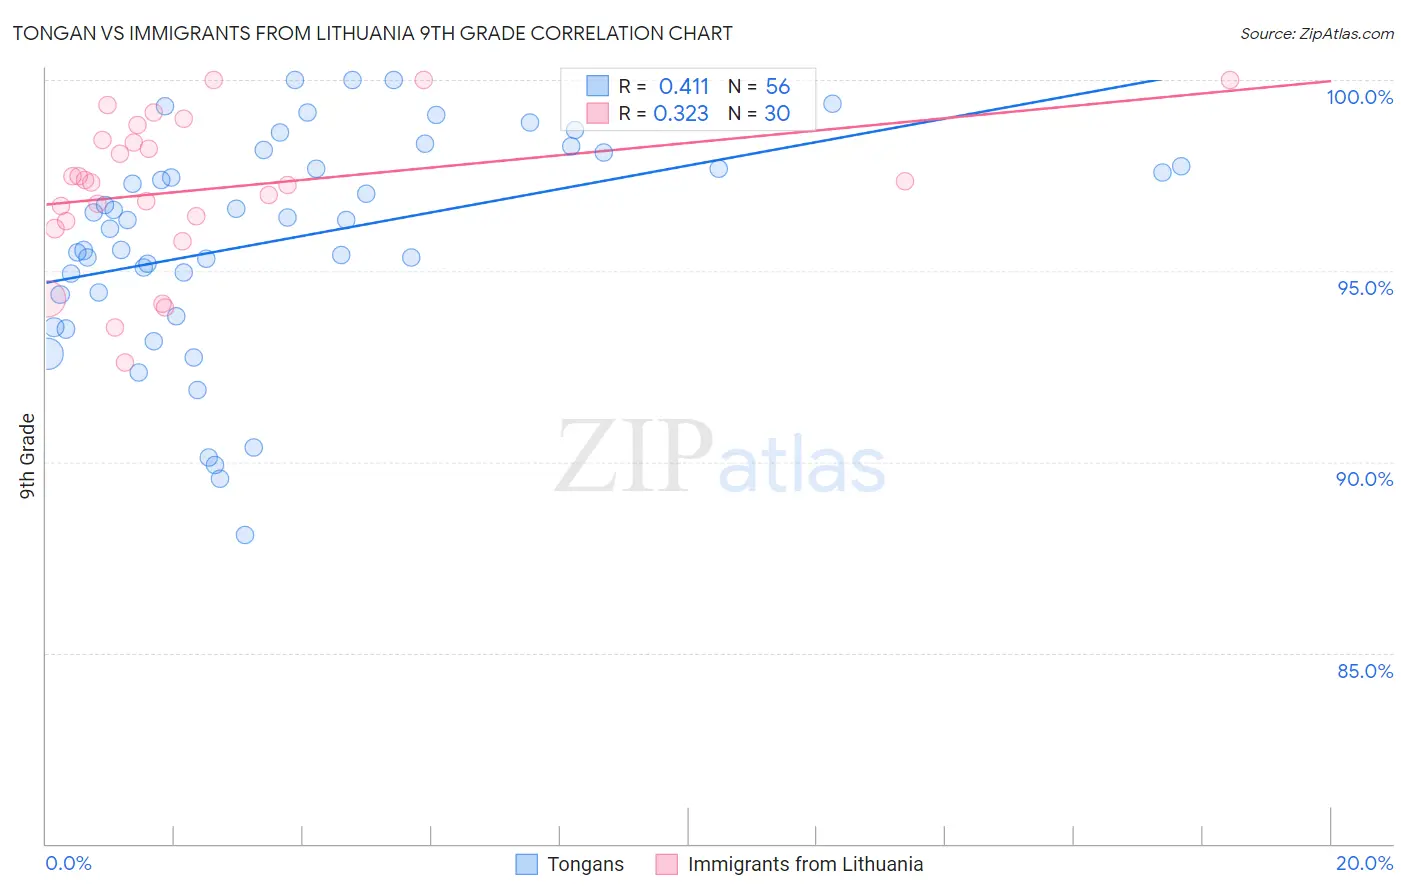
Tongan vs Immigrants from Lithuania 9th Grade Correlation Chart
The statistical analysis conducted on geographies consisting of 102,873,790 people shows a moderate positive correlation between the proportion of Tongans and percentage of population with at least 9th grade education in the United States with a correlation coefficient (R) of 0.411 and weighted average of 94.4%. Similarly, the statistical analysis conducted on geographies consisting of 117,724,932 people shows a mild positive correlation between the proportion of Immigrants from Lithuania and percentage of population with at least 9th grade education in the United States with a correlation coefficient (R) of 0.323 and weighted average of 95.8%, a difference of 1.5%.
9th Grade Correlation Summary
| Measurement | Tongan | Immigrants from Lithuania |
| Minimum | 88.1% | 92.6% |
| Maximum | 100.0% | 100.0% |
| Range | 11.9% | 7.4% |
| Mean | 95.8% | 97.1% |
| Median | 96.3% | 97.3% |
| Interquartile 25% (IQ1) | 94.4% | 96.3% |
| Interquartile 75% (IQ3) | 97.9% | 98.4% |
| Interquartile Range (IQR) | 3.5% | 2.1% |
| Standard Deviation (Sample) | 2.8% | 2.0% |
| Standard Deviation (Population) | 2.8% | 1.9% |
Similar Demographics by 9th Grade
Demographics Similar to Tongans by 9th Grade
In terms of 9th grade, the demographic groups most similar to Tongans are Ethiopian (94.4%, a difference of 0.020%), Subsaharan African (94.4%, a difference of 0.020%), Bahamian (94.4%, a difference of 0.030%), Immigrants from Sierra Leone (94.4%, a difference of 0.040%), and Immigrants from Asia (94.4%, a difference of 0.050%).
| Demographics | Rating | Rank | 9th Grade |
| Asians | 9.9 /100 | #217 | Tragic 94.5% |
| Portuguese | 9.2 /100 | #218 | Tragic 94.5% |
| Africans | 9.0 /100 | #219 | Tragic 94.5% |
| Indians (Asian) | 8.6 /100 | #220 | Tragic 94.5% |
| Immigrants | Eastern Africa | 8.2 /100 | #221 | Tragic 94.5% |
| Immigrants | Asia | 7.7 /100 | #222 | Tragic 94.4% |
| Bahamians | 7.0 /100 | #223 | Tragic 94.4% |
| Tongans | 6.0 /100 | #224 | Tragic 94.4% |
| Ethiopians | 5.4 /100 | #225 | Tragic 94.4% |
| Sub-Saharan Africans | 5.4 /100 | #226 | Tragic 94.4% |
| Immigrants | Sierra Leone | 4.8 /100 | #227 | Tragic 94.4% |
| Lumbee | 4.7 /100 | #228 | Tragic 94.4% |
| Immigrants | Southern Europe | 4.5 /100 | #229 | Tragic 94.3% |
| Apache | 4.2 /100 | #230 | Tragic 94.3% |
| Immigrants | Panama | 4.0 /100 | #231 | Tragic 94.3% |
Demographics Similar to Immigrants from Lithuania by 9th Grade
In terms of 9th grade, the demographic groups most similar to Immigrants from Lithuania are Cypriot (95.8%, a difference of 0.0%), Immigrants from Ireland (95.8%, a difference of 0.0%), Immigrants from Netherlands (95.8%, a difference of 0.010%), Immigrants from Australia (95.8%, a difference of 0.020%), and Immigrants from Belgium (95.8%, a difference of 0.020%).
| Demographics | Rating | Rank | 9th Grade |
| Ukrainians | 99.7 /100 | #62 | Exceptional 95.9% |
| Canadians | 99.7 /100 | #63 | Exceptional 95.9% |
| Zimbabweans | 99.7 /100 | #64 | Exceptional 95.9% |
| Immigrants | England | 99.6 /100 | #65 | Exceptional 95.9% |
| Immigrants | Netherlands | 99.6 /100 | #66 | Exceptional 95.8% |
| Cypriots | 99.6 /100 | #67 | Exceptional 95.8% |
| Immigrants | Ireland | 99.6 /100 | #68 | Exceptional 95.8% |
| Immigrants | Lithuania | 99.6 /100 | #69 | Exceptional 95.8% |
| Immigrants | Australia | 99.5 /100 | #70 | Exceptional 95.8% |
| Immigrants | Belgium | 99.5 /100 | #71 | Exceptional 95.8% |
| Turks | 99.5 /100 | #72 | Exceptional 95.8% |
| Immigrants | Singapore | 99.5 /100 | #73 | Exceptional 95.8% |
| Thais | 99.5 /100 | #74 | Exceptional 95.8% |
| Inupiat | 99.5 /100 | #75 | Exceptional 95.8% |
| Immigrants | Sweden | 99.5 /100 | #76 | Exceptional 95.8% |