Tongan vs Soviet Union 9th Grade
COMPARE
Tongan
Soviet Union
9th Grade
9th Grade Comparison
Tongans
Soviet Union
94.4%
9TH GRADE
6.0/ 100
METRIC RATING
224th/ 347
METRIC RANK
95.4%
9TH GRADE
95.6/ 100
METRIC RATING
119th/ 347
METRIC RANK
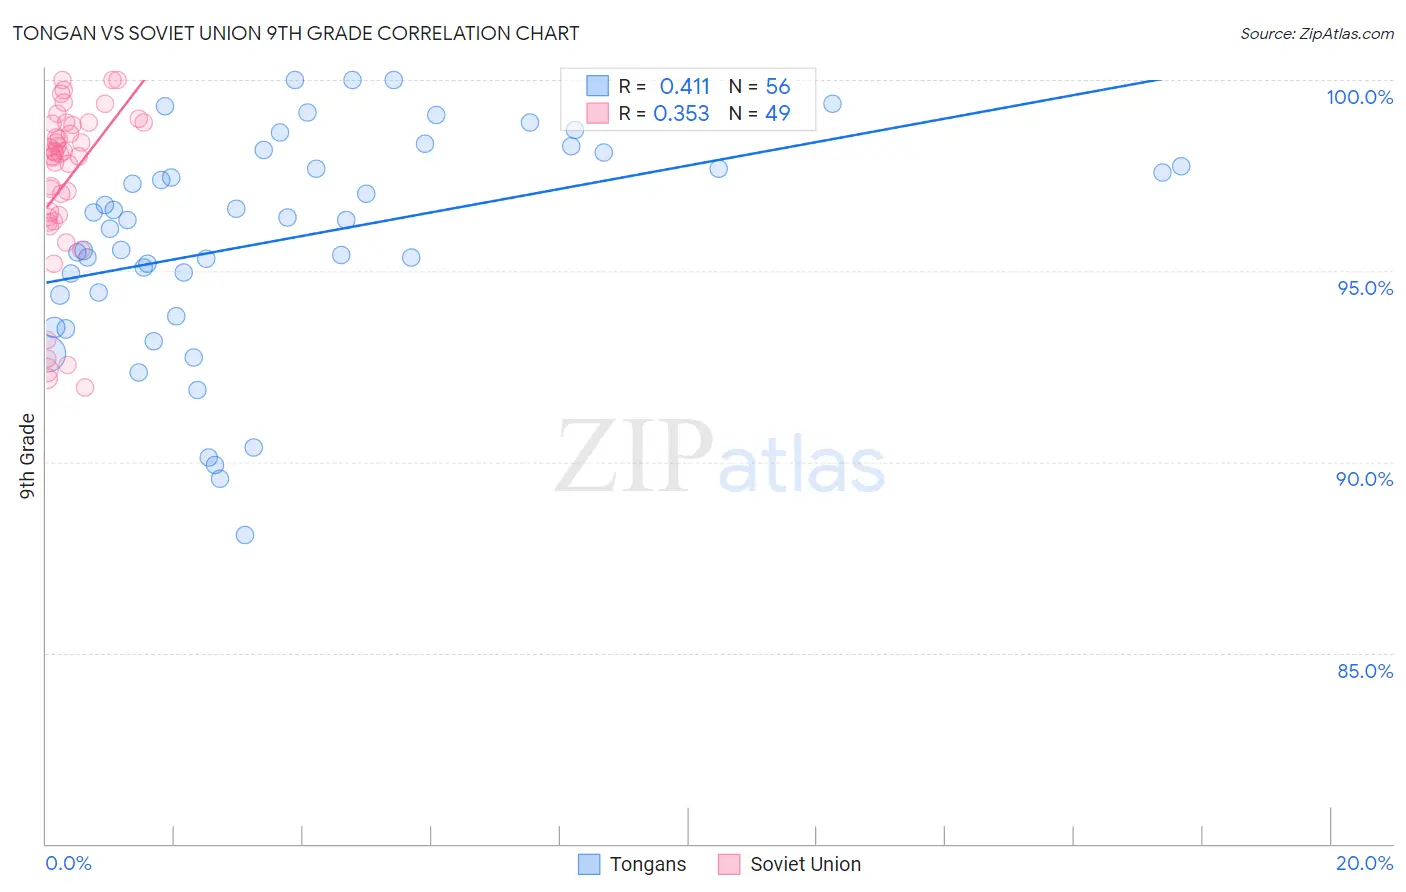
Tongan vs Soviet Union 9th Grade Correlation Chart
The statistical analysis conducted on geographies consisting of 102,873,790 people shows a moderate positive correlation between the proportion of Tongans and percentage of population with at least 9th grade education in the United States with a correlation coefficient (R) of 0.411 and weighted average of 94.4%. Similarly, the statistical analysis conducted on geographies consisting of 43,454,395 people shows a mild positive correlation between the proportion of Soviet Union and percentage of population with at least 9th grade education in the United States with a correlation coefficient (R) of 0.353 and weighted average of 95.4%, a difference of 1.1%.
9th Grade Correlation Summary
| Measurement | Tongan | Soviet Union |
| Minimum | 88.1% | 92.0% |
| Maximum | 100.0% | 100.0% |
| Range | 11.9% | 8.0% |
| Mean | 95.8% | 97.3% |
| Median | 96.3% | 98.1% |
| Interquartile 25% (IQ1) | 94.4% | 96.3% |
| Interquartile 75% (IQ3) | 97.9% | 98.9% |
| Interquartile Range (IQR) | 3.5% | 2.5% |
| Standard Deviation (Sample) | 2.8% | 2.2% |
| Standard Deviation (Population) | 2.8% | 2.2% |
Similar Demographics by 9th Grade
Demographics Similar to Tongans by 9th Grade
In terms of 9th grade, the demographic groups most similar to Tongans are Ethiopian (94.4%, a difference of 0.020%), Subsaharan African (94.4%, a difference of 0.020%), Bahamian (94.4%, a difference of 0.030%), Immigrants from Sierra Leone (94.4%, a difference of 0.040%), and Immigrants from Asia (94.4%, a difference of 0.050%).
| Demographics | Rating | Rank | 9th Grade |
| Asians | 9.9 /100 | #217 | Tragic 94.5% |
| Portuguese | 9.2 /100 | #218 | Tragic 94.5% |
| Africans | 9.0 /100 | #219 | Tragic 94.5% |
| Indians (Asian) | 8.6 /100 | #220 | Tragic 94.5% |
| Immigrants | Eastern Africa | 8.2 /100 | #221 | Tragic 94.5% |
| Immigrants | Asia | 7.7 /100 | #222 | Tragic 94.4% |
| Bahamians | 7.0 /100 | #223 | Tragic 94.4% |
| Tongans | 6.0 /100 | #224 | Tragic 94.4% |
| Ethiopians | 5.4 /100 | #225 | Tragic 94.4% |
| Sub-Saharan Africans | 5.4 /100 | #226 | Tragic 94.4% |
| Immigrants | Sierra Leone | 4.8 /100 | #227 | Tragic 94.4% |
| Lumbee | 4.7 /100 | #228 | Tragic 94.4% |
| Immigrants | Southern Europe | 4.5 /100 | #229 | Tragic 94.3% |
| Apache | 4.2 /100 | #230 | Tragic 94.3% |
| Immigrants | Panama | 4.0 /100 | #231 | Tragic 94.3% |
Demographics Similar to Soviet Union by 9th Grade
In terms of 9th grade, the demographic groups most similar to Soviet Union are Immigrants from Europe (95.4%, a difference of 0.0%), Immigrants from Romania (95.4%, a difference of 0.0%), Immigrants from Turkey (95.4%, a difference of 0.0%), Cambodian (95.4%, a difference of 0.0%), and Cree (95.4%, a difference of 0.0%).
| Demographics | Rating | Rank | 9th Grade |
| Immigrants | Croatia | 96.2 /100 | #112 | Exceptional 95.4% |
| Iroquois | 96.2 /100 | #113 | Exceptional 95.4% |
| German Russians | 96.1 /100 | #114 | Exceptional 95.4% |
| Burmese | 96.0 /100 | #115 | Exceptional 95.4% |
| Immigrants | Europe | 95.7 /100 | #116 | Exceptional 95.4% |
| Immigrants | Romania | 95.6 /100 | #117 | Exceptional 95.4% |
| Immigrants | Turkey | 95.6 /100 | #118 | Exceptional 95.4% |
| Soviet Union | 95.6 /100 | #119 | Exceptional 95.4% |
| Cambodians | 95.6 /100 | #120 | Exceptional 95.4% |
| Cree | 95.5 /100 | #121 | Exceptional 95.4% |
| Immigrants | Kuwait | 95.5 /100 | #122 | Exceptional 95.4% |
| Kiowa | 95.3 /100 | #123 | Exceptional 95.4% |
| Shoshone | 95.3 /100 | #124 | Exceptional 95.4% |
| Immigrants | South Central Asia | 95.1 /100 | #125 | Exceptional 95.4% |
| Immigrants | Serbia | 94.4 /100 | #126 | Exceptional 95.4% |