Immigrants from Europe vs Swiss No Schooling Completed
COMPARE
Immigrants from Europe
Swiss
No Schooling Completed
No Schooling Completed Comparison
Immigrants from Europe
Swiss
1.9%
NO SCHOOLING COMPLETED
93.7/ 100
METRIC RATING
125th/ 347
METRIC RANK
1.5%
NO SCHOOLING COMPLETED
100.0/ 100
METRIC RATING
32nd/ 347
METRIC RANK
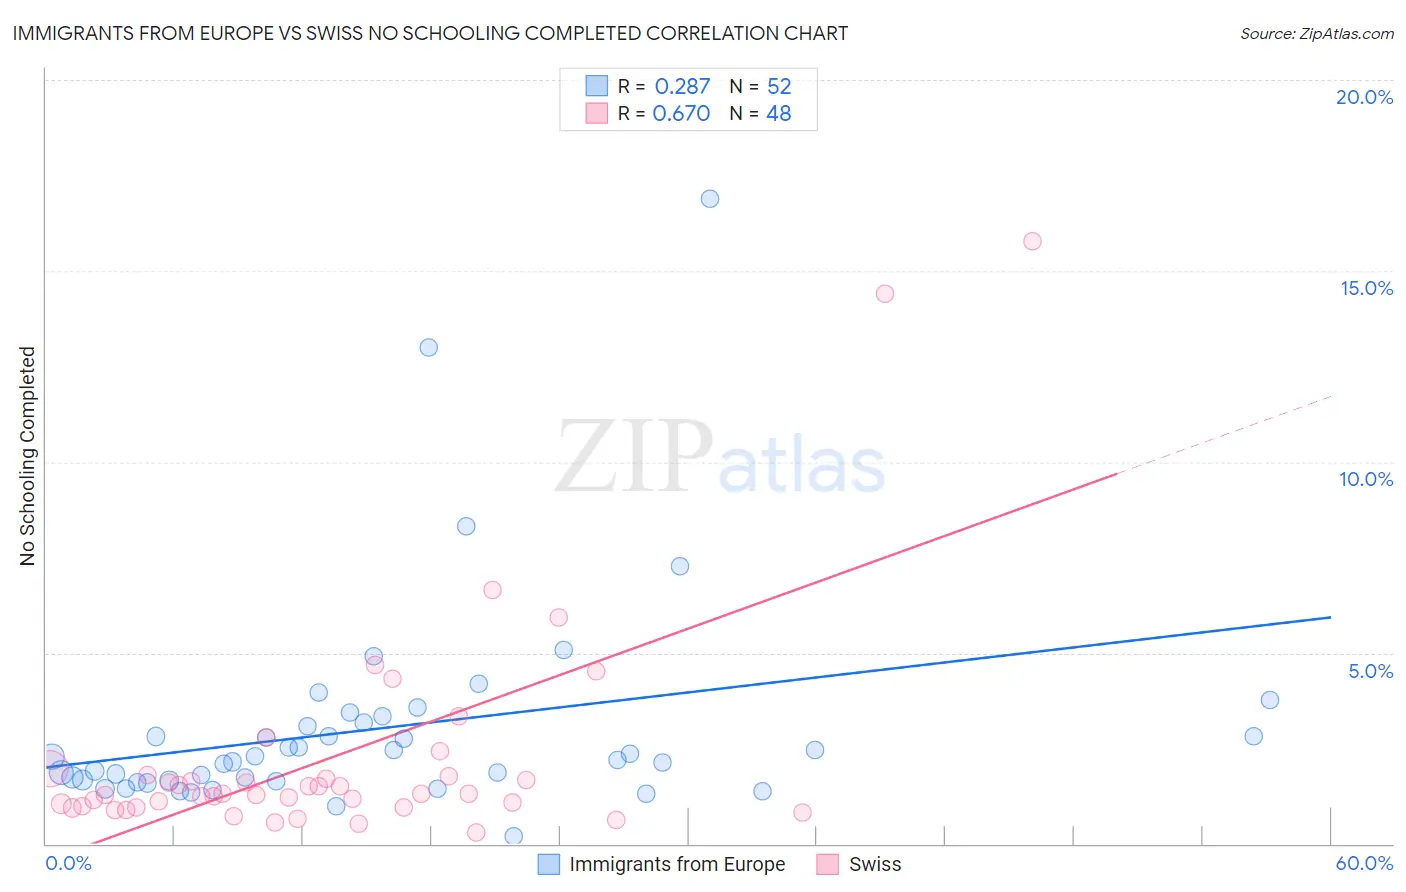
Immigrants from Europe vs Swiss No Schooling Completed Correlation Chart
The statistical analysis conducted on geographies consisting of 533,582,074 people shows a weak positive correlation between the proportion of Immigrants from Europe and percentage of population with no schooling in the United States with a correlation coefficient (R) of 0.287 and weighted average of 1.9%. Similarly, the statistical analysis conducted on geographies consisting of 455,291,102 people shows a significant positive correlation between the proportion of Swiss and percentage of population with no schooling in the United States with a correlation coefficient (R) of 0.670 and weighted average of 1.5%, a difference of 24.5%.
No Schooling Completed Correlation Summary
| Measurement | Immigrants from Europe | Swiss |
| Minimum | 0.21% | 0.31% |
| Maximum | 16.9% | 15.8% |
| Range | 16.7% | 15.5% |
| Mean | 3.0% | 2.3% |
| Median | 2.2% | 1.3% |
| Interquartile 25% (IQ1) | 1.6% | 0.97% |
| Interquartile 75% (IQ3) | 3.1% | 1.8% |
| Interquartile Range (IQR) | 1.5% | 0.82% |
| Standard Deviation (Sample) | 2.8% | 3.0% |
| Standard Deviation (Population) | 2.8% | 3.0% |
Similar Demographics by No Schooling Completed
Demographics Similar to Immigrants from Europe by No Schooling Completed
In terms of no schooling completed, the demographic groups most similar to Immigrants from Europe are Cambodian (1.9%, a difference of 0.090%), Immigrants from Kuwait (1.9%, a difference of 0.17%), Cree (1.9%, a difference of 0.53%), Immigrants from Croatia (1.9%, a difference of 0.56%), and Immigrants from Bulgaria (1.9%, a difference of 0.63%).
| Demographics | Rating | Rank | No Schooling Completed |
| Spanish | 95.5 /100 | #118 | Exceptional 1.9% |
| Iroquois | 95.1 /100 | #119 | Exceptional 1.9% |
| Immigrants | Bulgaria | 94.6 /100 | #120 | Exceptional 1.9% |
| Immigrants | Croatia | 94.5 /100 | #121 | Exceptional 1.9% |
| Cree | 94.5 /100 | #122 | Exceptional 1.9% |
| Immigrants | Kuwait | 93.9 /100 | #123 | Exceptional 1.9% |
| Cambodians | 93.8 /100 | #124 | Exceptional 1.9% |
| Immigrants | Europe | 93.7 /100 | #125 | Exceptional 1.9% |
| Immigrants | Romania | 92.6 /100 | #126 | Exceptional 1.9% |
| Israelis | 92.4 /100 | #127 | Exceptional 1.9% |
| Spaniards | 92.3 /100 | #128 | Exceptional 1.9% |
| Seminole | 92.0 /100 | #129 | Exceptional 1.9% |
| Palestinians | 91.8 /100 | #130 | Exceptional 1.9% |
| Immigrants | Hungary | 91.6 /100 | #131 | Exceptional 1.9% |
| Colville | 90.4 /100 | #132 | Exceptional 1.9% |
Demographics Similar to Swiss by No Schooling Completed
In terms of no schooling completed, the demographic groups most similar to Swiss are Inupiat (1.5%, a difference of 0.39%), British (1.5%, a difference of 0.42%), Italian (1.5%, a difference of 0.68%), Lumbee (1.5%, a difference of 0.91%), and Latvian (1.5%, a difference of 0.94%).
| Demographics | Rating | Rank | No Schooling Completed |
| French | 100.0 /100 | #25 | Exceptional 1.5% |
| Czechs | 100.0 /100 | #26 | Exceptional 1.5% |
| Scandinavians | 100.0 /100 | #27 | Exceptional 1.5% |
| French Canadians | 100.0 /100 | #28 | Exceptional 1.5% |
| Lumbee | 100.0 /100 | #29 | Exceptional 1.5% |
| British | 100.0 /100 | #30 | Exceptional 1.5% |
| Inupiat | 100.0 /100 | #31 | Exceptional 1.5% |
| Swiss | 100.0 /100 | #32 | Exceptional 1.5% |
| Italians | 100.0 /100 | #33 | Exceptional 1.5% |
| Latvians | 100.0 /100 | #34 | Exceptional 1.5% |
| Eastern Europeans | 100.0 /100 | #35 | Exceptional 1.6% |
| Aleuts | 99.9 /100 | #36 | Exceptional 1.6% |
| Belgians | 99.9 /100 | #37 | Exceptional 1.6% |
| Northern Europeans | 99.9 /100 | #38 | Exceptional 1.6% |
| Native Hawaiians | 99.9 /100 | #39 | Exceptional 1.6% |