Tohono O'odham vs Danish No Schooling Completed
COMPARE
Tohono O'odham
Danish
No Schooling Completed
No Schooling Completed Comparison
Tohono O'odham
Danes
2.3%
NO SCHOOLING COMPLETED
4.1/ 100
METRIC RATING
224th/ 347
METRIC RANK
1.5%
NO SCHOOLING COMPLETED
100.0/ 100
METRIC RATING
18th/ 347
METRIC RANK
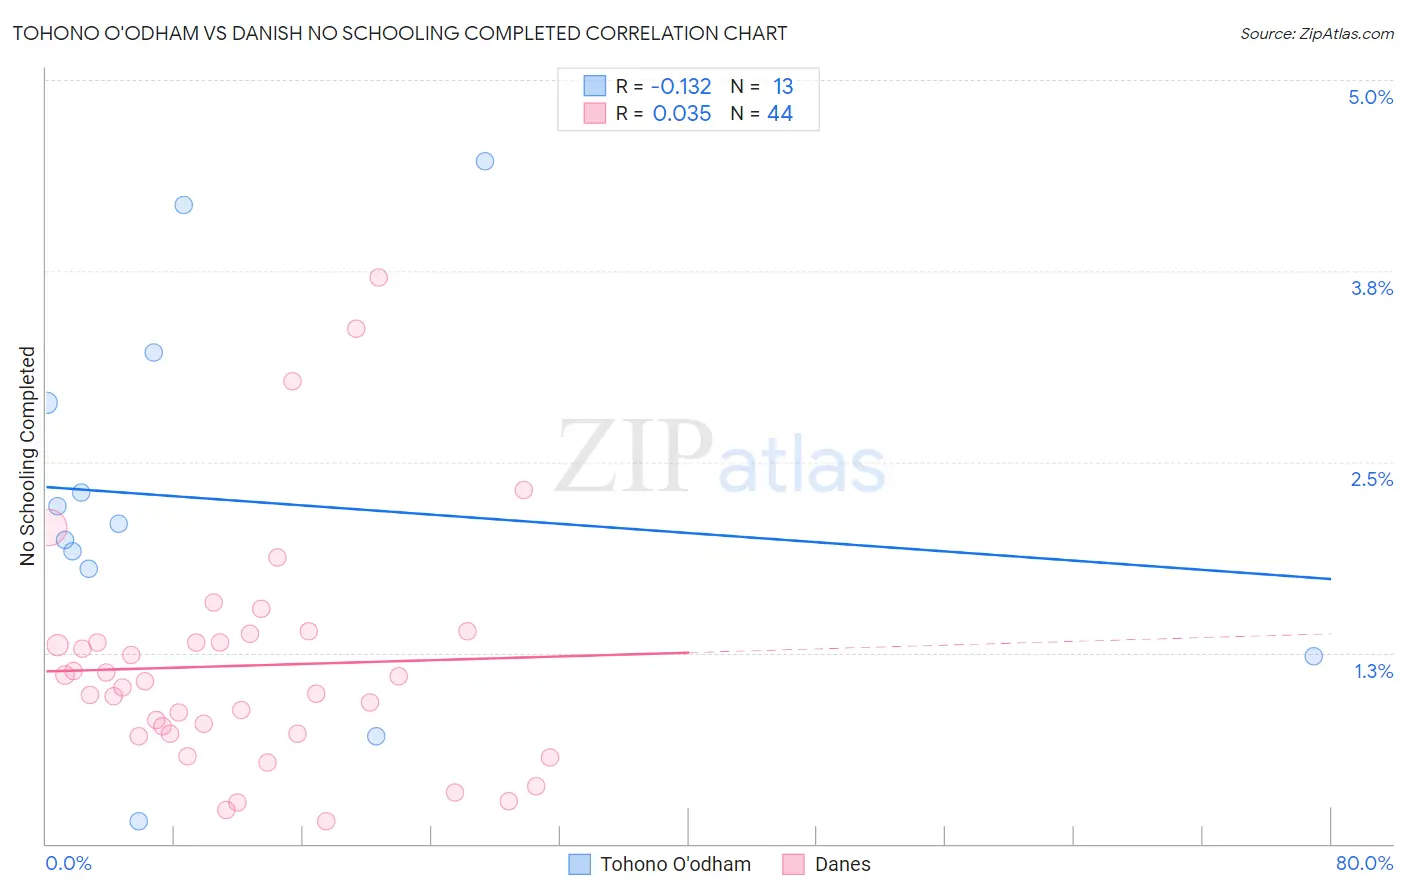
Tohono O'odham vs Danish No Schooling Completed Correlation Chart
The statistical analysis conducted on geographies consisting of 58,626,316 people shows a poor negative correlation between the proportion of Tohono O'odham and percentage of population with no schooling in the United States with a correlation coefficient (R) of -0.132 and weighted average of 2.3%. Similarly, the statistical analysis conducted on geographies consisting of 463,663,322 people shows no correlation between the proportion of Danes and percentage of population with no schooling in the United States with a correlation coefficient (R) of 0.035 and weighted average of 1.5%, a difference of 57.9%.
No Schooling Completed Correlation Summary
| Measurement | Tohono O'odham | Danish |
| Minimum | 0.14% | 0.15% |
| Maximum | 4.5% | 3.7% |
| Range | 4.3% | 3.6% |
| Mean | 2.2% | 1.2% |
| Median | 2.1% | 1.0% |
| Interquartile 25% (IQ1) | 1.5% | 0.72% |
| Interquartile 75% (IQ3) | 3.1% | 1.3% |
| Interquartile Range (IQR) | 1.5% | 0.62% |
| Standard Deviation (Sample) | 1.2% | 0.77% |
| Standard Deviation (Population) | 1.2% | 0.76% |
Similar Demographics by No Schooling Completed
Demographics Similar to Tohono O'odham by No Schooling Completed
In terms of no schooling completed, the demographic groups most similar to Tohono O'odham are Sudanese (2.3%, a difference of 0.0%), Sierra Leonean (2.3%, a difference of 0.020%), Immigrants from Uganda (2.3%, a difference of 0.070%), Immigrants from Lebanon (2.3%, a difference of 0.29%), and U.S. Virgin Islander (2.3%, a difference of 0.36%).
| Demographics | Rating | Rank | No Schooling Completed |
| Immigrants | Syria | 6.6 /100 | #217 | Tragic 2.3% |
| Immigrants | Nepal | 6.4 /100 | #218 | Tragic 2.3% |
| Senegalese | 5.6 /100 | #219 | Tragic 2.3% |
| Immigrants | Costa Rica | 5.1 /100 | #220 | Tragic 2.3% |
| Immigrants | Sudan | 5.0 /100 | #221 | Tragic 2.3% |
| Sub-Saharan Africans | 4.7 /100 | #222 | Tragic 2.3% |
| Immigrants | Lebanon | 4.5 /100 | #223 | Tragic 2.3% |
| Tohono O'odham | 4.1 /100 | #224 | Tragic 2.3% |
| Sudanese | 4.1 /100 | #225 | Tragic 2.3% |
| Sierra Leoneans | 4.1 /100 | #226 | Tragic 2.3% |
| Immigrants | Uganda | 4.0 /100 | #227 | Tragic 2.3% |
| U.S. Virgin Islanders | 3.7 /100 | #228 | Tragic 2.3% |
| Immigrants | Pakistan | 3.6 /100 | #229 | Tragic 2.3% |
| Puerto Ricans | 3.4 /100 | #230 | Tragic 2.3% |
| Immigrants | Uruguay | 3.4 /100 | #231 | Tragic 2.3% |
Demographics Similar to Danes by No Schooling Completed
In terms of no schooling completed, the demographic groups most similar to Danes are Alaskan Athabascan (1.5%, a difference of 0.10%), Welsh (1.5%, a difference of 0.23%), Croatian (1.5%, a difference of 0.30%), Finnish (1.5%, a difference of 0.31%), and Chinese (1.5%, a difference of 0.60%).
| Demographics | Rating | Rank | No Schooling Completed |
| Lithuanians | 100.0 /100 | #11 | Exceptional 1.4% |
| Irish | 100.0 /100 | #12 | Exceptional 1.4% |
| Poles | 100.0 /100 | #13 | Exceptional 1.4% |
| Scotch-Irish | 100.0 /100 | #14 | Exceptional 1.5% |
| Tlingit-Haida | 100.0 /100 | #15 | Exceptional 1.5% |
| Finns | 100.0 /100 | #16 | Exceptional 1.5% |
| Croatians | 100.0 /100 | #17 | Exceptional 1.5% |
| Danes | 100.0 /100 | #18 | Exceptional 1.5% |
| Alaskan Athabascans | 100.0 /100 | #19 | Exceptional 1.5% |
| Welsh | 100.0 /100 | #20 | Exceptional 1.5% |
| Chinese | 100.0 /100 | #21 | Exceptional 1.5% |
| Alaska Natives | 100.0 /100 | #22 | Exceptional 1.5% |
| Europeans | 100.0 /100 | #23 | Exceptional 1.5% |
| Pennsylvania Germans | 100.0 /100 | #24 | Exceptional 1.5% |
| French | 100.0 /100 | #25 | Exceptional 1.5% |