Immigrants from North America vs Swiss No Schooling Completed
COMPARE
Immigrants from North America
Swiss
No Schooling Completed
No Schooling Completed Comparison
Immigrants from North America
Swiss
1.6%
NO SCHOOLING COMPLETED
99.8/ 100
METRIC RATING
56th/ 347
METRIC RANK
1.5%
NO SCHOOLING COMPLETED
100.0/ 100
METRIC RATING
32nd/ 347
METRIC RANK
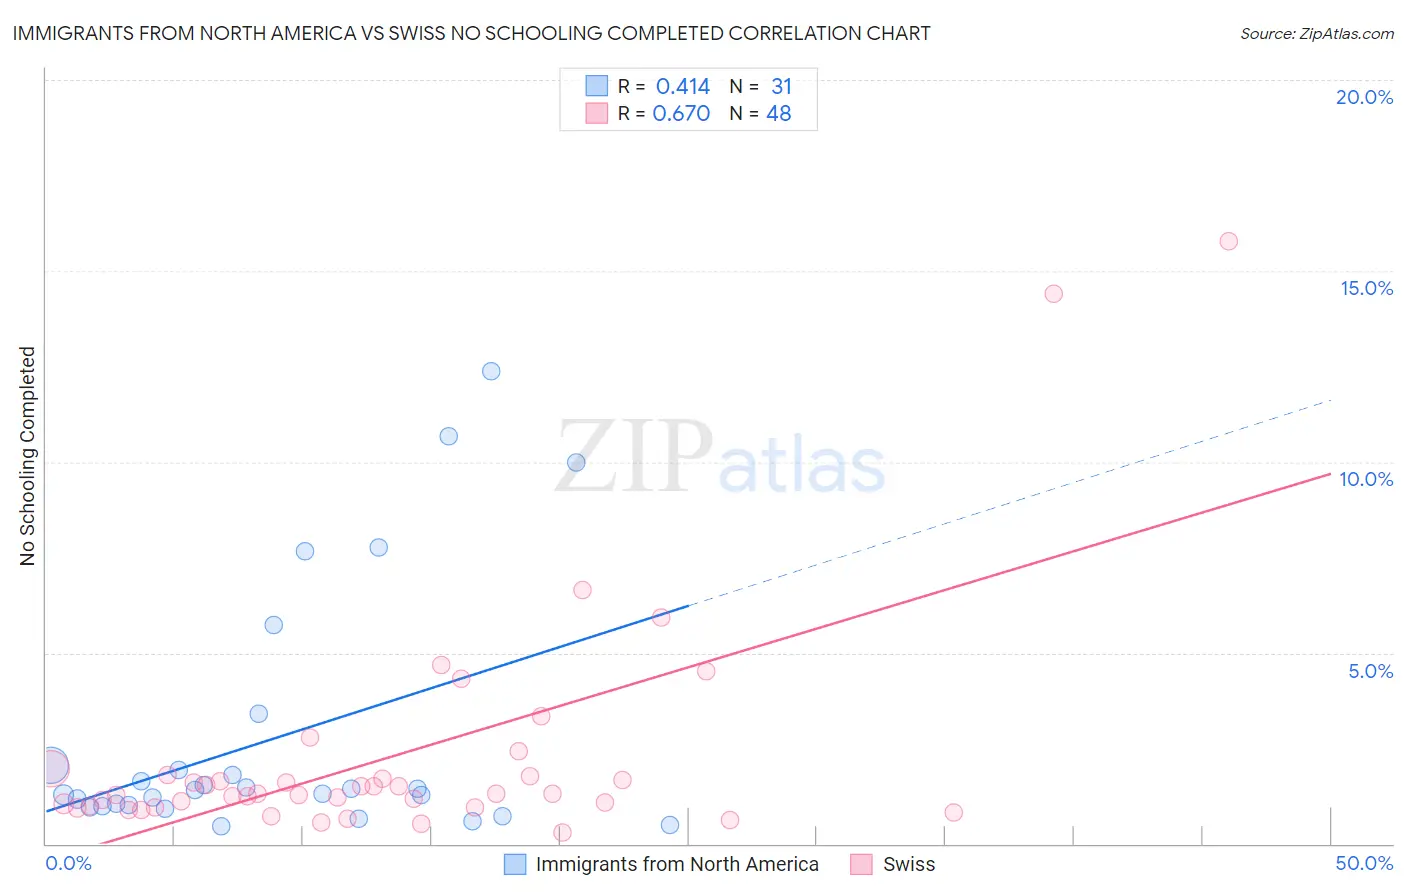
Immigrants from North America vs Swiss No Schooling Completed Correlation Chart
The statistical analysis conducted on geographies consisting of 454,496,769 people shows a moderate positive correlation between the proportion of Immigrants from North America and percentage of population with no schooling in the United States with a correlation coefficient (R) of 0.414 and weighted average of 1.6%. Similarly, the statistical analysis conducted on geographies consisting of 455,291,102 people shows a significant positive correlation between the proportion of Swiss and percentage of population with no schooling in the United States with a correlation coefficient (R) of 0.670 and weighted average of 1.5%, a difference of 7.4%.
No Schooling Completed Correlation Summary
| Measurement | Immigrants from North America | Swiss |
| Minimum | 0.45% | 0.31% |
| Maximum | 12.4% | 15.8% |
| Range | 11.9% | 15.5% |
| Mean | 2.8% | 2.3% |
| Median | 1.4% | 1.3% |
| Interquartile 25% (IQ1) | 1.00% | 0.97% |
| Interquartile 75% (IQ3) | 2.1% | 1.8% |
| Interquartile Range (IQR) | 1.1% | 0.82% |
| Standard Deviation (Sample) | 3.3% | 3.0% |
| Standard Deviation (Population) | 3.3% | 3.0% |
Similar Demographics by No Schooling Completed
Demographics Similar to Immigrants from North America by No Schooling Completed
In terms of no schooling completed, the demographic groups most similar to Immigrants from North America are Greek (1.6%, a difference of 0.0%), Crow (1.6%, a difference of 0.12%), Creek (1.6%, a difference of 0.15%), Immigrants from Canada (1.6%, a difference of 0.28%), and Austrian (1.6%, a difference of 0.31%).
| Demographics | Rating | Rank | No Schooling Completed |
| Whites/Caucasians | 99.9 /100 | #49 | Exceptional 1.6% |
| Celtics | 99.9 /100 | #50 | Exceptional 1.6% |
| Chippewa | 99.8 /100 | #51 | Exceptional 1.6% |
| Immigrants | Canada | 99.8 /100 | #52 | Exceptional 1.6% |
| Creek | 99.8 /100 | #53 | Exceptional 1.6% |
| Crow | 99.8 /100 | #54 | Exceptional 1.6% |
| Greeks | 99.8 /100 | #55 | Exceptional 1.6% |
| Immigrants | North America | 99.8 /100 | #56 | Exceptional 1.6% |
| Austrians | 99.8 /100 | #57 | Exceptional 1.6% |
| Kiowa | 99.8 /100 | #58 | Exceptional 1.6% |
| Slavs | 99.8 /100 | #59 | Exceptional 1.7% |
| Americans | 99.8 /100 | #60 | Exceptional 1.7% |
| Tsimshian | 99.8 /100 | #61 | Exceptional 1.7% |
| Immigrants | Northern Europe | 99.8 /100 | #62 | Exceptional 1.7% |
| Russians | 99.8 /100 | #63 | Exceptional 1.7% |
Demographics Similar to Swiss by No Schooling Completed
In terms of no schooling completed, the demographic groups most similar to Swiss are Inupiat (1.5%, a difference of 0.39%), British (1.5%, a difference of 0.42%), Italian (1.5%, a difference of 0.68%), Lumbee (1.5%, a difference of 0.91%), and Latvian (1.5%, a difference of 0.94%).
| Demographics | Rating | Rank | No Schooling Completed |
| French | 100.0 /100 | #25 | Exceptional 1.5% |
| Czechs | 100.0 /100 | #26 | Exceptional 1.5% |
| Scandinavians | 100.0 /100 | #27 | Exceptional 1.5% |
| French Canadians | 100.0 /100 | #28 | Exceptional 1.5% |
| Lumbee | 100.0 /100 | #29 | Exceptional 1.5% |
| British | 100.0 /100 | #30 | Exceptional 1.5% |
| Inupiat | 100.0 /100 | #31 | Exceptional 1.5% |
| Swiss | 100.0 /100 | #32 | Exceptional 1.5% |
| Italians | 100.0 /100 | #33 | Exceptional 1.5% |
| Latvians | 100.0 /100 | #34 | Exceptional 1.5% |
| Eastern Europeans | 100.0 /100 | #35 | Exceptional 1.6% |
| Aleuts | 99.9 /100 | #36 | Exceptional 1.6% |
| Belgians | 99.9 /100 | #37 | Exceptional 1.6% |
| Northern Europeans | 99.9 /100 | #38 | Exceptional 1.6% |
| Native Hawaiians | 99.9 /100 | #39 | Exceptional 1.6% |