Tohono O'odham vs Immigrants from Panama No Schooling Completed
COMPARE
Tohono O'odham
Immigrants from Panama
No Schooling Completed
No Schooling Completed Comparison
Tohono O'odham
Immigrants from Panama
2.3%
NO SCHOOLING COMPLETED
4.1/ 100
METRIC RATING
224th/ 347
METRIC RANK
2.3%
NO SCHOOLING COMPLETED
8.8/ 100
METRIC RATING
211th/ 347
METRIC RANK
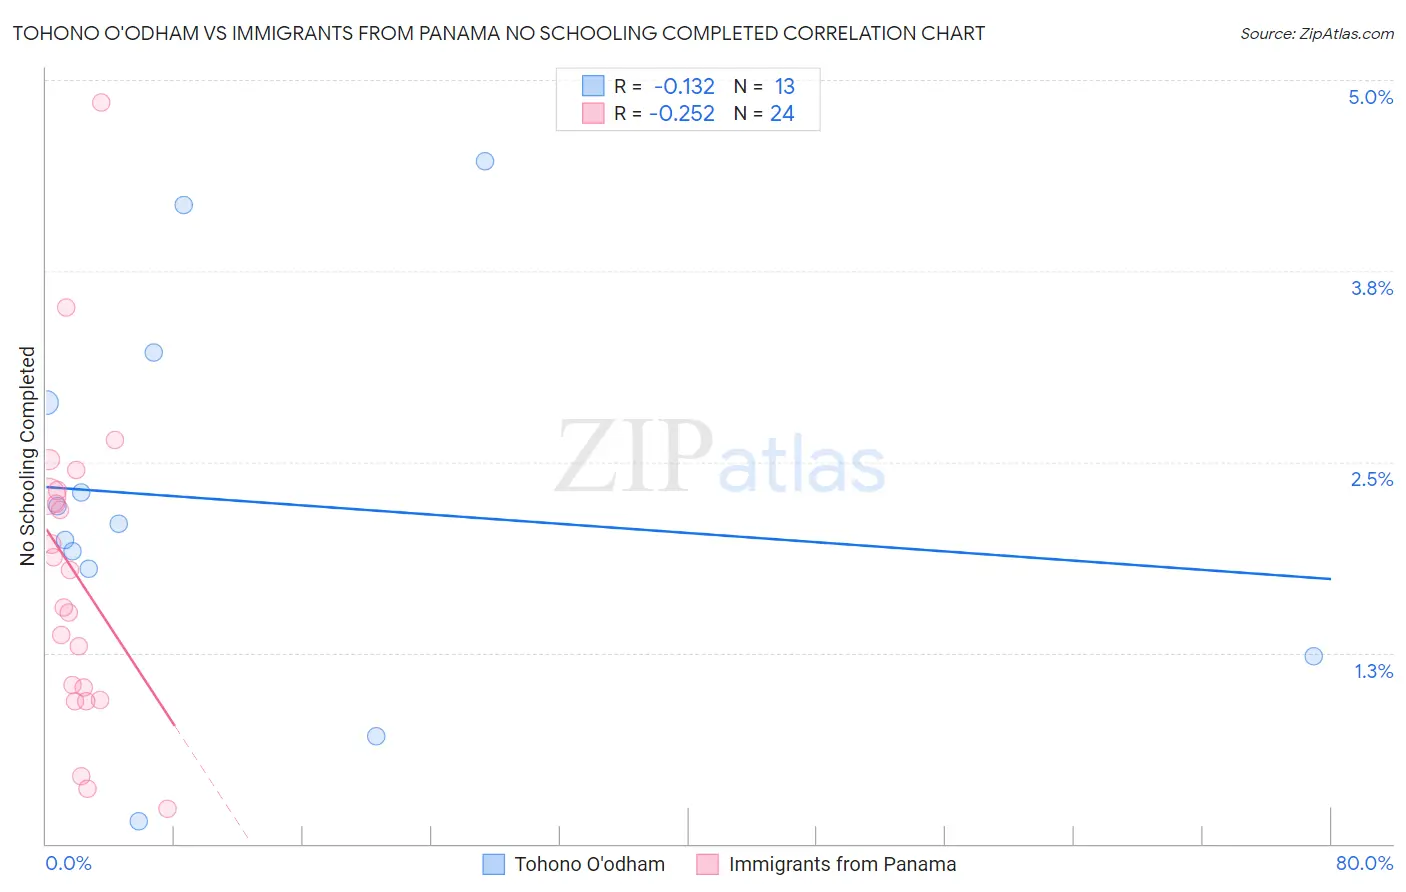
Tohono O'odham vs Immigrants from Panama No Schooling Completed Correlation Chart
The statistical analysis conducted on geographies consisting of 58,626,316 people shows a poor negative correlation between the proportion of Tohono O'odham and percentage of population with no schooling in the United States with a correlation coefficient (R) of -0.132 and weighted average of 2.3%. Similarly, the statistical analysis conducted on geographies consisting of 220,555,519 people shows a weak negative correlation between the proportion of Immigrants from Panama and percentage of population with no schooling in the United States with a correlation coefficient (R) of -0.252 and weighted average of 2.3%, a difference of 2.5%.
No Schooling Completed Correlation Summary
| Measurement | Tohono O'odham | Immigrants from Panama |
| Minimum | 0.14% | 0.23% |
| Maximum | 4.5% | 4.9% |
| Range | 4.3% | 4.6% |
| Mean | 2.2% | 1.8% |
| Median | 2.1% | 1.7% |
| Interquartile 25% (IQ1) | 1.5% | 0.98% |
| Interquartile 75% (IQ3) | 3.1% | 2.3% |
| Interquartile Range (IQR) | 1.5% | 1.3% |
| Standard Deviation (Sample) | 1.2% | 1.0% |
| Standard Deviation (Population) | 1.2% | 1.0% |
Demographics Similar to Tohono O'odham and Immigrants from Panama by No Schooling Completed
In terms of no schooling completed, the demographic groups most similar to Tohono O'odham are Sudanese (2.3%, a difference of 0.0%), Sierra Leonean (2.3%, a difference of 0.020%), Immigrants from Uganda (2.3%, a difference of 0.070%), Immigrants from Lebanon (2.3%, a difference of 0.29%), and Subsaharan African (2.3%, a difference of 0.44%). Similarly, the demographic groups most similar to Immigrants from Panama are Immigrants from Morocco (2.3%, a difference of 0.010%), Ute (2.3%, a difference of 0.20%), Samoan (2.3%, a difference of 0.24%), Native/Alaskan (2.2%, a difference of 0.45%), and Immigrants from Oceania (2.2%, a difference of 0.53%).
| Demographics | Rating | Rank | No Schooling Completed |
| South American Indians | 11.0 /100 | #207 | Poor 2.2% |
| Uruguayans | 11.0 /100 | #208 | Poor 2.2% |
| Immigrants | Oceania | 10.2 /100 | #209 | Poor 2.2% |
| Natives/Alaskans | 10.0 /100 | #210 | Tragic 2.2% |
| Immigrants | Panama | 8.8 /100 | #211 | Tragic 2.3% |
| Immigrants | Morocco | 8.7 /100 | #212 | Tragic 2.3% |
| Ute | 8.2 /100 | #213 | Tragic 2.3% |
| Samoans | 8.2 /100 | #214 | Tragic 2.3% |
| Immigrants | Zaire | 7.2 /100 | #215 | Tragic 2.3% |
| Tongans | 6.8 /100 | #216 | Tragic 2.3% |
| Immigrants | Syria | 6.6 /100 | #217 | Tragic 2.3% |
| Immigrants | Nepal | 6.4 /100 | #218 | Tragic 2.3% |
| Senegalese | 5.6 /100 | #219 | Tragic 2.3% |
| Immigrants | Costa Rica | 5.1 /100 | #220 | Tragic 2.3% |
| Immigrants | Sudan | 5.0 /100 | #221 | Tragic 2.3% |
| Sub-Saharan Africans | 4.7 /100 | #222 | Tragic 2.3% |
| Immigrants | Lebanon | 4.5 /100 | #223 | Tragic 2.3% |
| Tohono O'odham | 4.1 /100 | #224 | Tragic 2.3% |
| Sudanese | 4.1 /100 | #225 | Tragic 2.3% |
| Sierra Leoneans | 4.1 /100 | #226 | Tragic 2.3% |
| Immigrants | Uganda | 4.0 /100 | #227 | Tragic 2.3% |