Tohono O'odham vs Immigrants from Albania 4th Grade
COMPARE
Tohono O'odham
Immigrants from Albania
4th Grade
4th Grade Comparison
Tohono O'odham
Immigrants from Albania
97.3%
4TH GRADE
8.4/ 100
METRIC RATING
212th/ 347
METRIC RANK
97.4%
4TH GRADE
27.7/ 100
METRIC RATING
196th/ 347
METRIC RANK
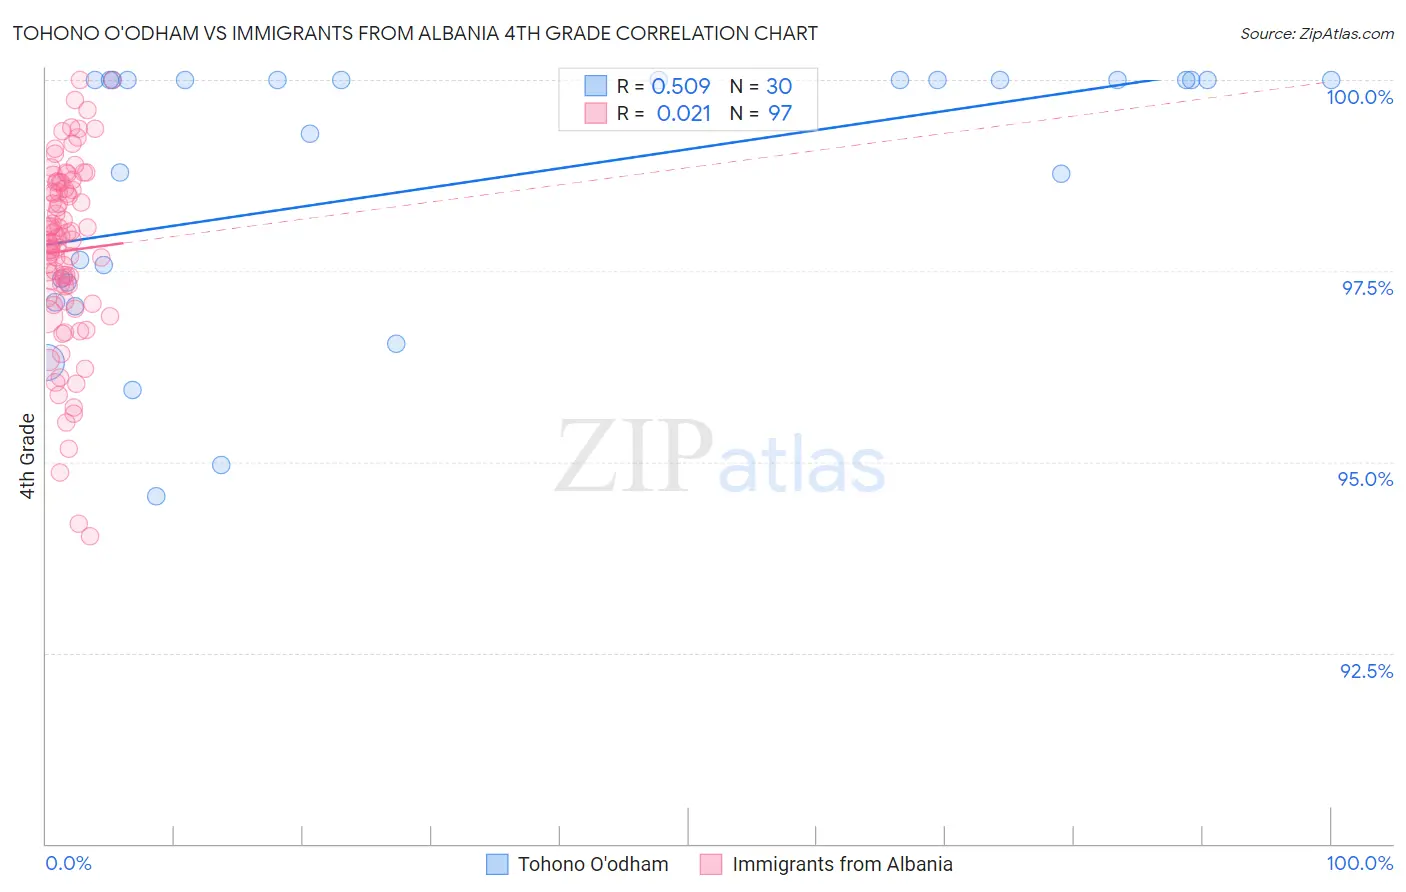
Tohono O'odham vs Immigrants from Albania 4th Grade Correlation Chart
The statistical analysis conducted on geographies consisting of 58,723,100 people shows a substantial positive correlation between the proportion of Tohono O'odham and percentage of population with at least 4th grade education in the United States with a correlation coefficient (R) of 0.509 and weighted average of 97.3%. Similarly, the statistical analysis conducted on geographies consisting of 119,265,453 people shows no correlation between the proportion of Immigrants from Albania and percentage of population with at least 4th grade education in the United States with a correlation coefficient (R) of 0.021 and weighted average of 97.4%, a difference of 0.13%.
4th Grade Correlation Summary
| Measurement | Tohono O'odham | Immigrants from Albania |
| Minimum | 94.6% | 94.0% |
| Maximum | 100.0% | 100.0% |
| Range | 5.4% | 6.0% |
| Mean | 98.6% | 97.8% |
| Median | 100.0% | 97.9% |
| Interquartile 25% (IQ1) | 97.3% | 97.1% |
| Interquartile 75% (IQ3) | 100.0% | 98.6% |
| Interquartile Range (IQR) | 2.7% | 1.5% |
| Standard Deviation (Sample) | 1.7% | 1.2% |
| Standard Deviation (Population) | 1.7% | 1.2% |
Demographics Similar to Tohono O'odham and Immigrants from Albania by 4th Grade
In terms of 4th grade, the demographic groups most similar to Tohono O'odham are Costa Rican (97.3%, a difference of 0.0%), Laotian (97.3%, a difference of 0.010%), Immigrants from Oceania (97.3%, a difference of 0.010%), Sudanese (97.3%, a difference of 0.010%), and Immigrants from Nepal (97.3%, a difference of 0.010%). Similarly, the demographic groups most similar to Immigrants from Albania are Portuguese (97.4%, a difference of 0.010%), Paraguayan (97.4%, a difference of 0.010%), Hawaiian (97.4%, a difference of 0.010%), Guamanian/Chamorro (97.4%, a difference of 0.020%), and Native/Alaskan (97.4%, a difference of 0.040%).
| Demographics | Rating | Rank | 4th Grade |
| Portuguese | 29.2 /100 | #194 | Fair 97.4% |
| Paraguayans | 28.9 /100 | #195 | Fair 97.4% |
| Immigrants | Albania | 27.7 /100 | #196 | Fair 97.4% |
| Hawaiians | 25.6 /100 | #197 | Fair 97.4% |
| Guamanians/Chamorros | 23.0 /100 | #198 | Fair 97.4% |
| Natives/Alaskans | 20.6 /100 | #199 | Fair 97.4% |
| Immigrants | Uganda | 19.8 /100 | #200 | Poor 97.4% |
| Immigrants | Southern Europe | 16.2 /100 | #201 | Poor 97.4% |
| Immigrants | Chile | 16.1 /100 | #202 | Poor 97.4% |
| Immigrants | Northern Africa | 15.1 /100 | #203 | Poor 97.4% |
| Africans | 14.6 /100 | #204 | Poor 97.4% |
| Paiute | 13.2 /100 | #205 | Poor 97.3% |
| Immigrants | Zaire | 12.8 /100 | #206 | Poor 97.3% |
| Moroccans | 11.3 /100 | #207 | Poor 97.3% |
| Immigrants | Bahamas | 10.8 /100 | #208 | Poor 97.3% |
| Laotians | 9.3 /100 | #209 | Tragic 97.3% |
| Immigrants | Oceania | 9.1 /100 | #210 | Tragic 97.3% |
| Sudanese | 9.0 /100 | #211 | Tragic 97.3% |
| Tohono O'odham | 8.4 /100 | #212 | Tragic 97.3% |
| Costa Ricans | 8.3 /100 | #213 | Tragic 97.3% |
| Immigrants | Nepal | 7.7 /100 | #214 | Tragic 97.3% |