Tohono O'odham vs Cuban 4th Grade
COMPARE
Tohono O'odham
Cuban
4th Grade
4th Grade Comparison
Tohono O'odham
Cubans
97.3%
4TH GRADE
8.4/ 100
METRIC RATING
212th/ 347
METRIC RANK
96.9%
4TH GRADE
0.2/ 100
METRIC RATING
270th/ 347
METRIC RANK
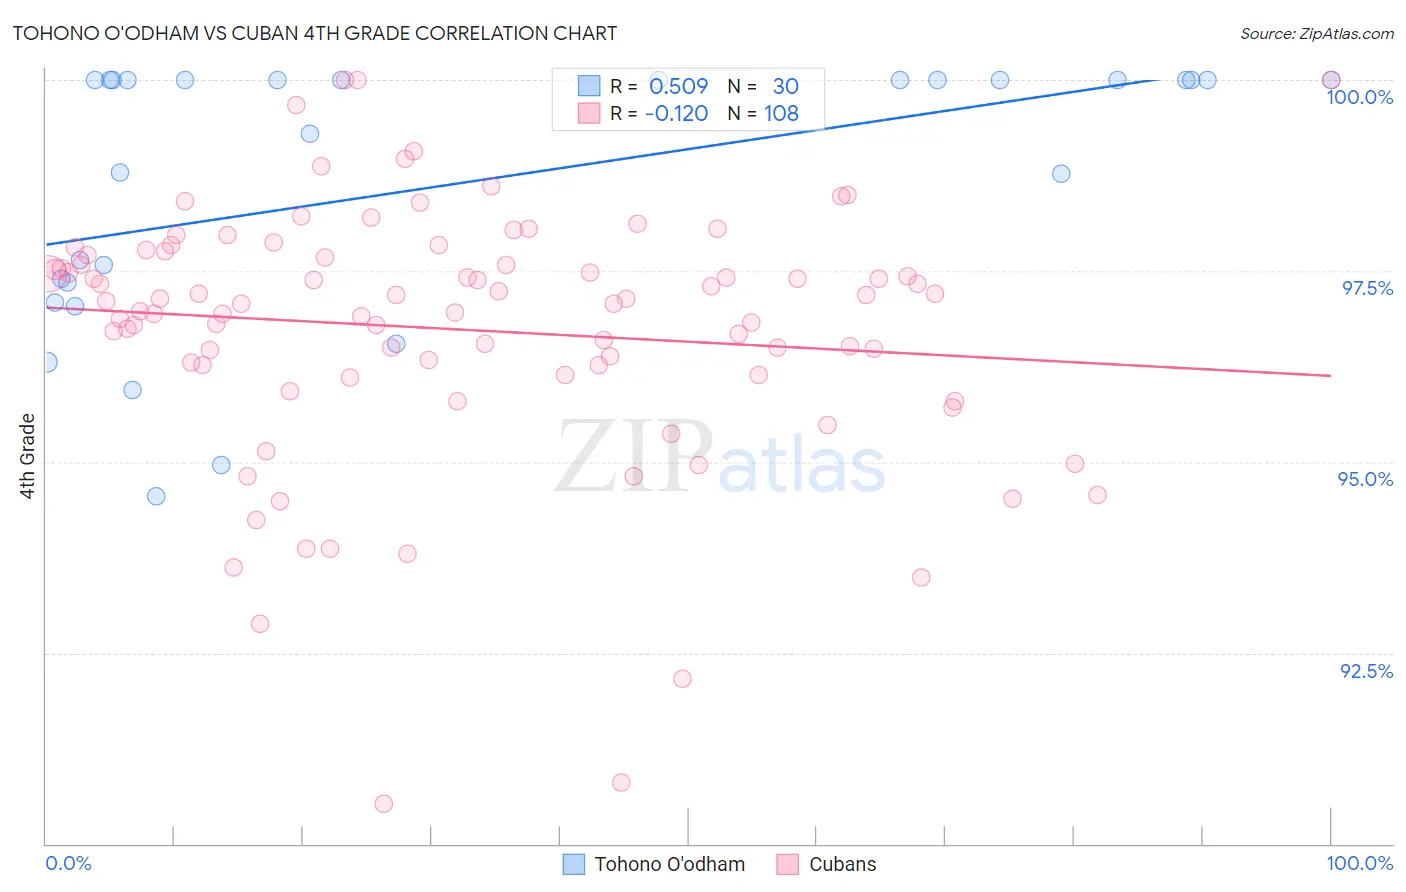
Tohono O'odham vs Cuban 4th Grade Correlation Chart
The statistical analysis conducted on geographies consisting of 58,723,100 people shows a substantial positive correlation between the proportion of Tohono O'odham and percentage of population with at least 4th grade education in the United States with a correlation coefficient (R) of 0.509 and weighted average of 97.3%. Similarly, the statistical analysis conducted on geographies consisting of 449,326,865 people shows a poor negative correlation between the proportion of Cubans and percentage of population with at least 4th grade education in the United States with a correlation coefficient (R) of -0.120 and weighted average of 96.9%, a difference of 0.39%.
4th Grade Correlation Summary
| Measurement | Tohono O'odham | Cuban |
| Minimum | 94.6% | 90.5% |
| Maximum | 100.0% | 100.0% |
| Range | 5.4% | 9.5% |
| Mean | 98.6% | 96.7% |
| Median | 100.0% | 97.1% |
| Interquartile 25% (IQ1) | 97.3% | 96.2% |
| Interquartile 75% (IQ3) | 100.0% | 97.7% |
| Interquartile Range (IQR) | 2.7% | 1.5% |
| Standard Deviation (Sample) | 1.7% | 1.7% |
| Standard Deviation (Population) | 1.7% | 1.7% |
Similar Demographics by 4th Grade
Demographics Similar to Tohono O'odham by 4th Grade
In terms of 4th grade, the demographic groups most similar to Tohono O'odham are Costa Rican (97.3%, a difference of 0.0%), Laotian (97.3%, a difference of 0.010%), Immigrants from Oceania (97.3%, a difference of 0.010%), Sudanese (97.3%, a difference of 0.010%), and Immigrants from Nepal (97.3%, a difference of 0.010%).
| Demographics | Rating | Rank | 4th Grade |
| Paiute | 13.2 /100 | #205 | Poor 97.3% |
| Immigrants | Zaire | 12.8 /100 | #206 | Poor 97.3% |
| Moroccans | 11.3 /100 | #207 | Poor 97.3% |
| Immigrants | Bahamas | 10.8 /100 | #208 | Poor 97.3% |
| Laotians | 9.3 /100 | #209 | Tragic 97.3% |
| Immigrants | Oceania | 9.1 /100 | #210 | Tragic 97.3% |
| Sudanese | 9.0 /100 | #211 | Tragic 97.3% |
| Tohono O'odham | 8.4 /100 | #212 | Tragic 97.3% |
| Costa Ricans | 8.3 /100 | #213 | Tragic 97.3% |
| Immigrants | Nepal | 7.7 /100 | #214 | Tragic 97.3% |
| Immigrants | Morocco | 7.1 /100 | #215 | Tragic 97.3% |
| Samoans | 6.8 /100 | #216 | Tragic 97.3% |
| Sierra Leoneans | 6.5 /100 | #217 | Tragic 97.3% |
| Iraqis | 6.3 /100 | #218 | Tragic 97.3% |
| Tongans | 5.8 /100 | #219 | Tragic 97.3% |
Demographics Similar to Cubans by 4th Grade
In terms of 4th grade, the demographic groups most similar to Cubans are Immigrants from Peru (96.9%, a difference of 0.010%), Fijian (96.9%, a difference of 0.010%), Immigrants from Uzbekistan (96.9%, a difference of 0.020%), Immigrants from Cameroon (96.9%, a difference of 0.020%), and Trinidadian and Tobagonian (96.9%, a difference of 0.030%).
| Demographics | Rating | Rank | 4th Grade |
| Immigrants | Jamaica | 0.3 /100 | #263 | Tragic 97.0% |
| Taiwanese | 0.3 /100 | #264 | Tragic 97.0% |
| Armenians | 0.3 /100 | #265 | Tragic 97.0% |
| Immigrants | China | 0.3 /100 | #266 | Tragic 97.0% |
| Immigrants | Nigeria | 0.3 /100 | #267 | Tragic 97.0% |
| Ghanaians | 0.2 /100 | #268 | Tragic 97.0% |
| Immigrants | Uzbekistan | 0.2 /100 | #269 | Tragic 96.9% |
| Cubans | 0.2 /100 | #270 | Tragic 96.9% |
| Immigrants | Peru | 0.1 /100 | #271 | Tragic 96.9% |
| Fijians | 0.1 /100 | #272 | Tragic 96.9% |
| Immigrants | Cameroon | 0.1 /100 | #273 | Tragic 96.9% |
| Trinidadians and Tobagonians | 0.1 /100 | #274 | Tragic 96.9% |
| Immigrants | Ghana | 0.1 /100 | #275 | Tragic 96.9% |
| Yaqui | 0.1 /100 | #276 | Tragic 96.9% |
| Immigrants | Western Africa | 0.1 /100 | #277 | Tragic 96.9% |