Immigrants from Southern Europe vs Malaysian No Schooling Completed
COMPARE
Immigrants from Southern Europe
Malaysian
No Schooling Completed
No Schooling Completed Comparison
Immigrants from Southern Europe
Malaysians
2.2%
NO SCHOOLING COMPLETED
23.8/ 100
METRIC RATING
197th/ 347
METRIC RANK
2.8%
NO SCHOOLING COMPLETED
0.0/ 100
METRIC RATING
293rd/ 347
METRIC RANK
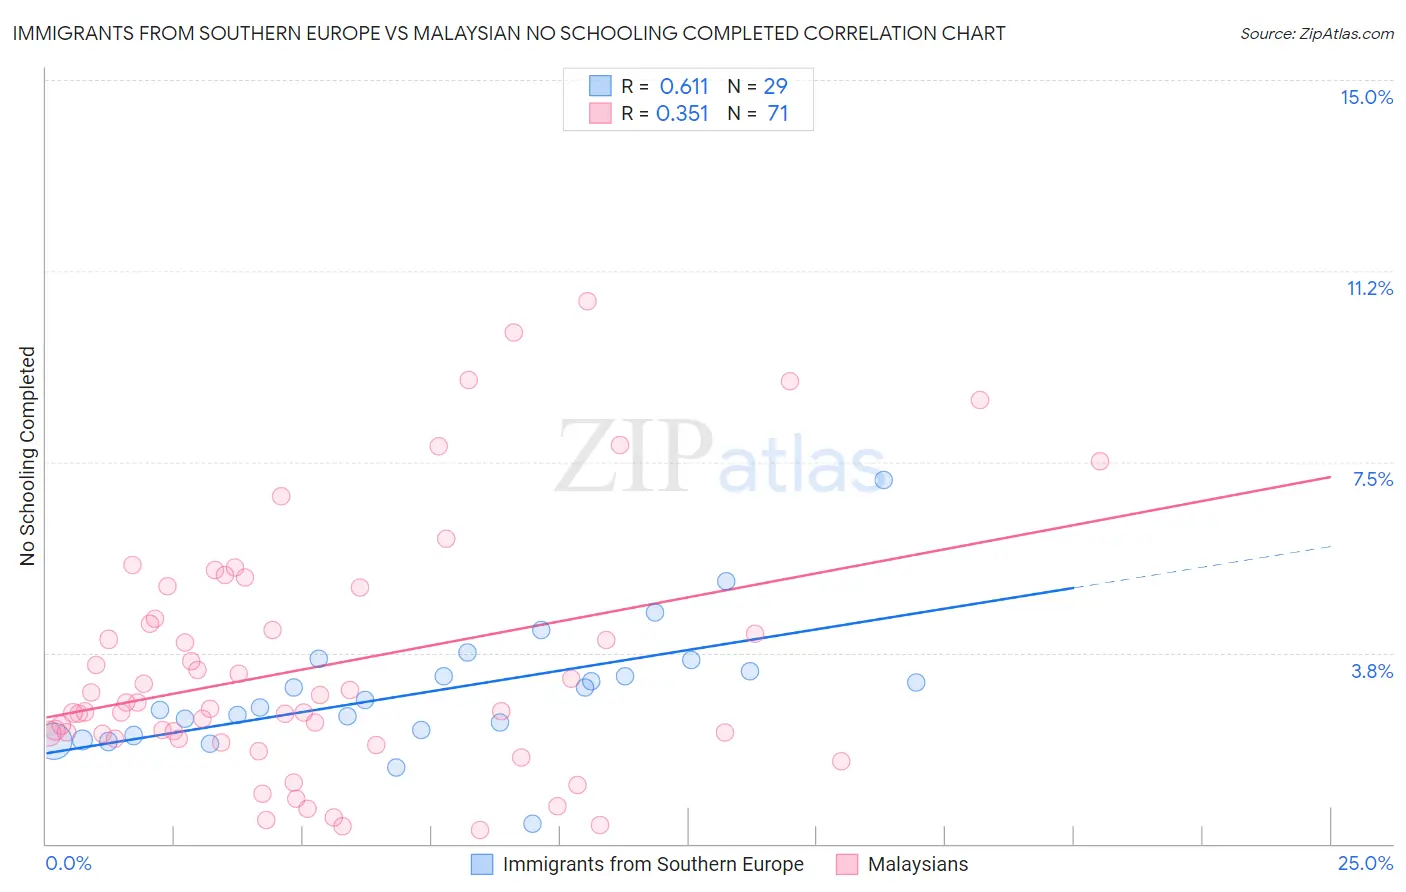
Immigrants from Southern Europe vs Malaysian No Schooling Completed Correlation Chart
The statistical analysis conducted on geographies consisting of 398,295,822 people shows a significant positive correlation between the proportion of Immigrants from Southern Europe and percentage of population with no schooling in the United States with a correlation coefficient (R) of 0.611 and weighted average of 2.2%. Similarly, the statistical analysis conducted on geographies consisting of 225,077,175 people shows a mild positive correlation between the proportion of Malaysians and percentage of population with no schooling in the United States with a correlation coefficient (R) of 0.351 and weighted average of 2.8%, a difference of 27.3%.
No Schooling Completed Correlation Summary
| Measurement | Immigrants from Southern Europe | Malaysian |
| Minimum | 0.38% | 0.27% |
| Maximum | 7.1% | 10.6% |
| Range | 6.8% | 10.4% |
| Mean | 3.0% | 3.5% |
| Median | 2.8% | 2.7% |
| Interquartile 25% (IQ1) | 2.2% | 2.1% |
| Interquartile 75% (IQ3) | 3.5% | 4.4% |
| Interquartile Range (IQR) | 1.3% | 2.4% |
| Standard Deviation (Sample) | 1.2% | 2.4% |
| Standard Deviation (Population) | 1.2% | 2.4% |
Similar Demographics by No Schooling Completed
Demographics Similar to Immigrants from Southern Europe by No Schooling Completed
In terms of no schooling completed, the demographic groups most similar to Immigrants from Southern Europe are Immigrants from Chile (2.2%, a difference of 0.18%), African (2.2%, a difference of 0.35%), Immigrants from Ukraine (2.2%, a difference of 0.41%), Hawaiian (2.2%, a difference of 0.56%), and Immigrants from Albania (2.2%, a difference of 0.76%).
| Demographics | Rating | Rank | No Schooling Completed |
| Spanish Americans | 32.6 /100 | #190 | Fair 2.1% |
| Bermudans | 30.7 /100 | #191 | Fair 2.1% |
| Guamanians/Chamorros | 29.8 /100 | #192 | Fair 2.2% |
| Paraguayans | 29.3 /100 | #193 | Fair 2.2% |
| Immigrants | Albania | 28.3 /100 | #194 | Fair 2.2% |
| Hawaiians | 27.0 /100 | #195 | Fair 2.2% |
| Immigrants | Ukraine | 26.1 /100 | #196 | Fair 2.2% |
| Immigrants | Southern Europe | 23.8 /100 | #197 | Fair 2.2% |
| Immigrants | Chile | 22.7 /100 | #198 | Fair 2.2% |
| Africans | 21.8 /100 | #199 | Fair 2.2% |
| Immigrants | Northern Africa | 19.5 /100 | #200 | Poor 2.2% |
| Costa Ricans | 17.1 /100 | #201 | Poor 2.2% |
| Moroccans | 13.7 /100 | #202 | Poor 2.2% |
| Laotians | 13.3 /100 | #203 | Poor 2.2% |
| Hopi | 12.9 /100 | #204 | Poor 2.2% |
Demographics Similar to Malaysians by No Schooling Completed
In terms of no schooling completed, the demographic groups most similar to Malaysians are Immigrants from Eritrea (2.8%, a difference of 0.17%), Immigrants from Grenada (2.8%, a difference of 0.41%), Houma (2.8%, a difference of 0.69%), Immigrants (2.8%, a difference of 0.79%), and British West Indian (2.7%, a difference of 1.5%).
| Demographics | Rating | Rank | No Schooling Completed |
| Immigrants | Portugal | 0.0 /100 | #286 | Tragic 2.7% |
| Immigrants | Afghanistan | 0.0 /100 | #287 | Tragic 2.7% |
| Immigrants | St. Vincent and the Grenadines | 0.0 /100 | #288 | Tragic 2.7% |
| Immigrants | Thailand | 0.0 /100 | #289 | Tragic 2.7% |
| Immigrants | Hong Kong | 0.0 /100 | #290 | Tragic 2.7% |
| British West Indians | 0.0 /100 | #291 | Tragic 2.7% |
| Immigrants | Grenada | 0.0 /100 | #292 | Tragic 2.8% |
| Malaysians | 0.0 /100 | #293 | Tragic 2.8% |
| Immigrants | Eritrea | 0.0 /100 | #294 | Tragic 2.8% |
| Houma | 0.0 /100 | #295 | Tragic 2.8% |
| Immigrants | Immigrants | 0.0 /100 | #296 | Tragic 2.8% |
| Immigrants | Cuba | 0.0 /100 | #297 | Tragic 2.8% |
| Immigrants | Dominica | 0.0 /100 | #298 | Tragic 2.8% |
| Central American Indians | 0.0 /100 | #299 | Tragic 2.8% |
| Haitians | 0.0 /100 | #300 | Tragic 2.9% |