Tlingit-Haida vs Malaysian In Labor Force | Age 25-29
COMPARE
Tlingit-Haida
Malaysian
In Labor Force | Age 25-29
In Labor Force | Age 25-29 Comparison
Tlingit-Haida
Malaysians
84.4%
IN LABOR FORCE | AGE 25-29
19.3/ 100
METRIC RATING
197th/ 347
METRIC RANK
84.6%
IN LABOR FORCE | AGE 25-29
46.8/ 100
METRIC RATING
176th/ 347
METRIC RANK
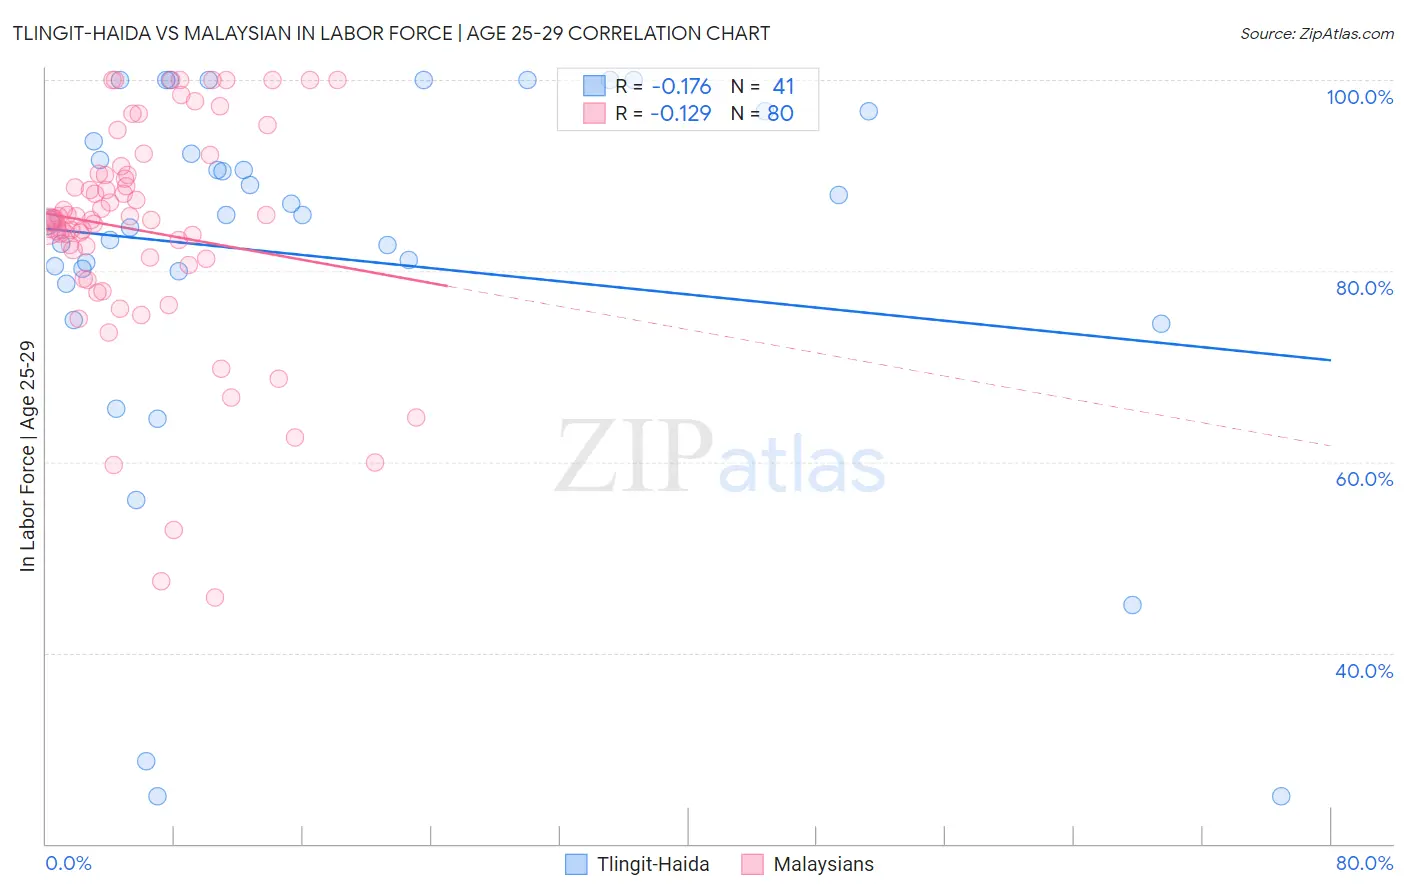
Tlingit-Haida vs Malaysian In Labor Force | Age 25-29 Correlation Chart
The statistical analysis conducted on geographies consisting of 60,865,267 people shows a poor negative correlation between the proportion of Tlingit-Haida and labor force participation rate among population between the ages 25 and 29 in the United States with a correlation coefficient (R) of -0.176 and weighted average of 84.4%. Similarly, the statistical analysis conducted on geographies consisting of 226,081,957 people shows a poor negative correlation between the proportion of Malaysians and labor force participation rate among population between the ages 25 and 29 in the United States with a correlation coefficient (R) of -0.129 and weighted average of 84.6%, a difference of 0.24%.
In Labor Force | Age 25-29 Correlation Summary
| Measurement | Tlingit-Haida | Malaysian |
| Minimum | 25.0% | 45.8% |
| Maximum | 100.0% | 100.0% |
| Range | 75.0% | 54.2% |
| Mean | 81.4% | 84.2% |
| Median | 85.8% | 85.4% |
| Interquartile 25% (IQ1) | 79.3% | 80.9% |
| Interquartile 75% (IQ3) | 95.2% | 90.1% |
| Interquartile Range (IQR) | 15.8% | 9.2% |
| Standard Deviation (Sample) | 19.9% | 11.8% |
| Standard Deviation (Population) | 19.6% | 11.7% |
Similar Demographics by In Labor Force | Age 25-29
Demographics Similar to Tlingit-Haida by In Labor Force | Age 25-29
In terms of in labor force | age 25-29, the demographic groups most similar to Tlingit-Haida are Immigrants from South Eastern Asia (84.4%, a difference of 0.0%), Immigrants from Iraq (84.4%, a difference of 0.0%), Immigrants from Germany (84.4%, a difference of 0.010%), Portuguese (84.4%, a difference of 0.020%), and Immigrants from Israel (84.4%, a difference of 0.020%).
| Demographics | Rating | Rank | In Labor Force | Age 25-29 |
| Welsh | 31.1 /100 | #190 | Fair 84.5% |
| Zimbabweans | 28.7 /100 | #191 | Fair 84.5% |
| English | 25.8 /100 | #192 | Fair 84.5% |
| South American Indians | 25.0 /100 | #193 | Fair 84.5% |
| Portuguese | 21.2 /100 | #194 | Fair 84.4% |
| Immigrants | Israel | 20.8 /100 | #195 | Fair 84.4% |
| Immigrants | South Eastern Asia | 19.5 /100 | #196 | Poor 84.4% |
| Tlingit-Haida | 19.3 /100 | #197 | Poor 84.4% |
| Immigrants | Iraq | 19.0 /100 | #198 | Poor 84.4% |
| Immigrants | Germany | 18.3 /100 | #199 | Poor 84.4% |
| Immigrants | Kazakhstan | 17.5 /100 | #200 | Poor 84.4% |
| Laotians | 16.6 /100 | #201 | Poor 84.4% |
| Afghans | 15.9 /100 | #202 | Poor 84.4% |
| Immigrants | Afghanistan | 15.6 /100 | #203 | Poor 84.4% |
| Venezuelans | 15.1 /100 | #204 | Poor 84.4% |
Demographics Similar to Malaysians by In Labor Force | Age 25-29
In terms of in labor force | age 25-29, the demographic groups most similar to Malaysians are Hungarian (84.6%, a difference of 0.010%), Immigrants from China (84.6%, a difference of 0.010%), Immigrants from Thailand (84.6%, a difference of 0.010%), Assyrian/Chaldean/Syriac (84.7%, a difference of 0.020%), and Palestinian (84.7%, a difference of 0.020%).
| Demographics | Rating | Rank | In Labor Force | Age 25-29 |
| Celtics | 52.5 /100 | #169 | Average 84.7% |
| Tongans | 52.4 /100 | #170 | Average 84.7% |
| Immigrants | Vietnam | 50.5 /100 | #171 | Average 84.7% |
| Immigrants | Western Europe | 50.4 /100 | #172 | Average 84.7% |
| Assyrians/Chaldeans/Syriacs | 50.2 /100 | #173 | Average 84.7% |
| Palestinians | 50.0 /100 | #174 | Average 84.7% |
| Hungarians | 47.8 /100 | #175 | Average 84.6% |
| Malaysians | 46.8 /100 | #176 | Average 84.6% |
| Immigrants | China | 45.7 /100 | #177 | Average 84.6% |
| Immigrants | Thailand | 45.2 /100 | #178 | Average 84.6% |
| Immigrants | Argentina | 44.0 /100 | #179 | Average 84.6% |
| Immigrants | South America | 42.9 /100 | #180 | Average 84.6% |
| Immigrants | Norway | 41.9 /100 | #181 | Average 84.6% |
| Europeans | 40.3 /100 | #182 | Average 84.6% |
| Scottish | 40.1 /100 | #183 | Average 84.6% |