Chilean vs Immigrants from Sweden Master's Degree
COMPARE
Chilean
Immigrants from Sweden
Master's Degree
Master's Degree Comparison
Chileans
Immigrants from Sweden
16.9%
MASTER'S DEGREE
98.6/ 100
METRIC RATING
102nd/ 347
METRIC RANK
20.3%
MASTER'S DEGREE
100.0/ 100
METRIC RATING
24th/ 347
METRIC RANK
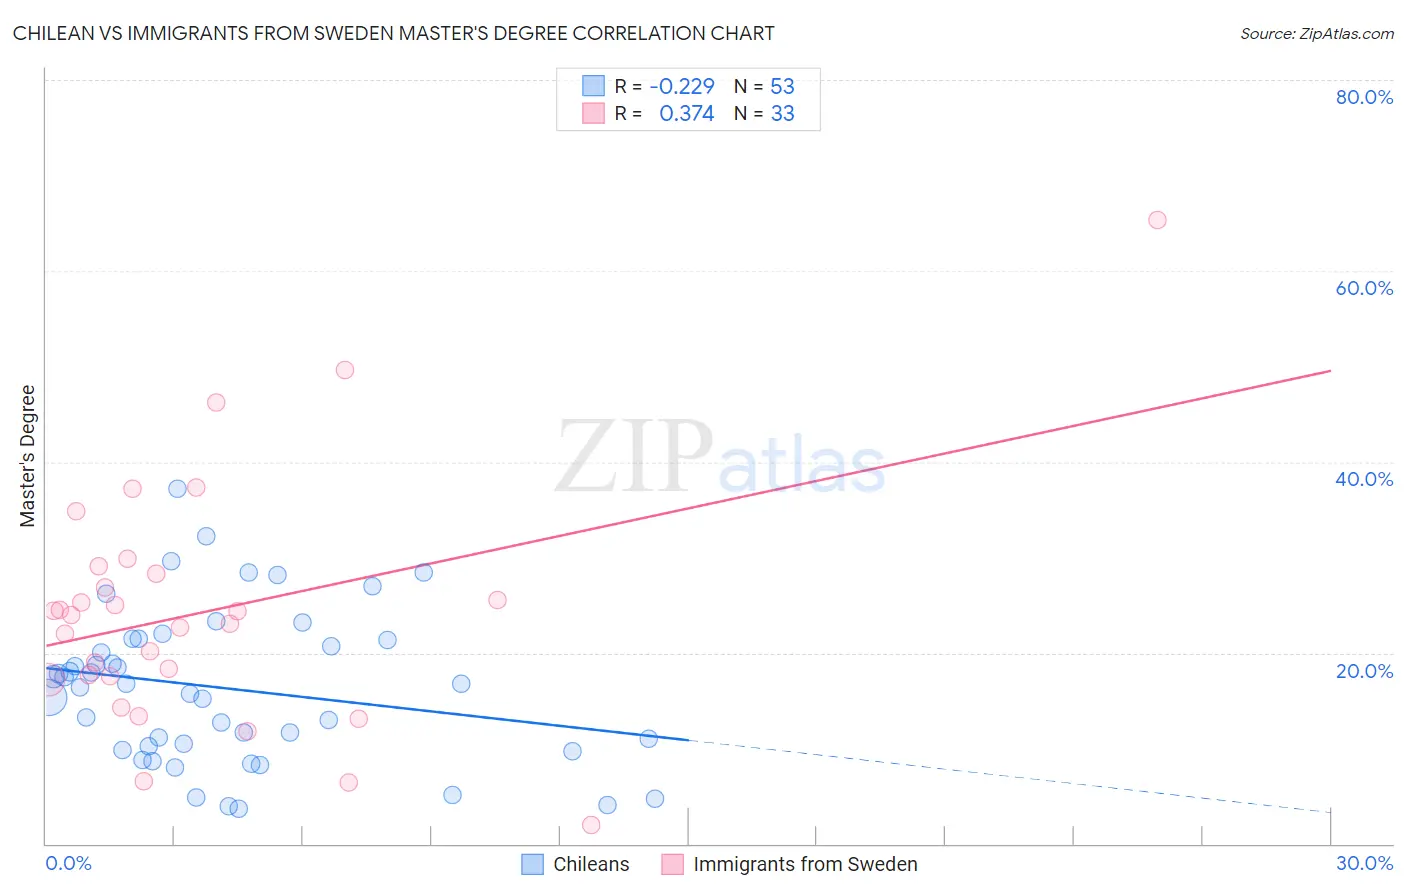
Chilean vs Immigrants from Sweden Master's Degree Correlation Chart
The statistical analysis conducted on geographies consisting of 256,643,247 people shows a weak negative correlation between the proportion of Chileans and percentage of population with at least master's degree education in the United States with a correlation coefficient (R) of -0.229 and weighted average of 16.9%. Similarly, the statistical analysis conducted on geographies consisting of 164,715,920 people shows a mild positive correlation between the proportion of Immigrants from Sweden and percentage of population with at least master's degree education in the United States with a correlation coefficient (R) of 0.374 and weighted average of 20.3%, a difference of 19.7%.
Master's Degree Correlation Summary
| Measurement | Chilean | Immigrants from Sweden |
| Minimum | 3.6% | 2.0% |
| Maximum | 37.2% | 65.4% |
| Range | 33.5% | 63.4% |
| Mean | 16.3% | 24.3% |
| Median | 16.7% | 24.0% |
| Interquartile 25% (IQ1) | 10.0% | 17.3% |
| Interquartile 75% (IQ3) | 21.4% | 28.6% |
| Interquartile Range (IQR) | 11.4% | 11.3% |
| Standard Deviation (Sample) | 7.9% | 12.7% |
| Standard Deviation (Population) | 7.8% | 12.5% |
Similar Demographics by Master's Degree
Demographics Similar to Chileans by Master's Degree
In terms of master's degree, the demographic groups most similar to Chileans are Immigrants from Nepal (17.0%, a difference of 0.080%), Albanian (17.0%, a difference of 0.26%), Alsatian (16.9%, a difference of 0.33%), Ukrainian (16.9%, a difference of 0.45%), and Laotian (17.0%, a difference of 0.47%).
| Demographics | Rating | Rank | Master's Degree |
| Immigrants | Morocco | 98.9 /100 | #95 | Exceptional 17.1% |
| Immigrants | Northern Africa | 98.9 /100 | #96 | Exceptional 17.1% |
| Immigrants | England | 98.8 /100 | #97 | Exceptional 17.0% |
| Immigrants | Ukraine | 98.8 /100 | #98 | Exceptional 17.0% |
| Laotians | 98.8 /100 | #99 | Exceptional 17.0% |
| Albanians | 98.7 /100 | #100 | Exceptional 17.0% |
| Immigrants | Nepal | 98.6 /100 | #101 | Exceptional 17.0% |
| Chileans | 98.6 /100 | #102 | Exceptional 16.9% |
| Alsatians | 98.4 /100 | #103 | Exceptional 16.9% |
| Ukrainians | 98.3 /100 | #104 | Exceptional 16.9% |
| Syrians | 98.3 /100 | #105 | Exceptional 16.8% |
| Immigrants | Albania | 98.1 /100 | #106 | Exceptional 16.8% |
| Armenians | 98.0 /100 | #107 | Exceptional 16.8% |
| Sierra Leoneans | 98.0 /100 | #108 | Exceptional 16.8% |
| Moroccans | 98.0 /100 | #109 | Exceptional 16.8% |
Demographics Similar to Immigrants from Sweden by Master's Degree
In terms of master's degree, the demographic groups most similar to Immigrants from Sweden are Immigrants from France (20.3%, a difference of 0.070%), Israeli (20.3%, a difference of 0.35%), Immigrants from Ireland (20.4%, a difference of 0.77%), Indian (Asian) (20.5%, a difference of 0.88%), and Immigrants from Hong Kong (20.5%, a difference of 0.90%).
| Demographics | Rating | Rank | Master's Degree |
| Immigrants | South Central Asia | 100.0 /100 | #17 | Exceptional 20.7% |
| Soviet Union | 100.0 /100 | #18 | Exceptional 20.5% |
| Immigrants | Hong Kong | 100.0 /100 | #19 | Exceptional 20.5% |
| Indians (Asian) | 100.0 /100 | #20 | Exceptional 20.5% |
| Immigrants | Ireland | 100.0 /100 | #21 | Exceptional 20.4% |
| Israelis | 100.0 /100 | #22 | Exceptional 20.3% |
| Immigrants | France | 100.0 /100 | #23 | Exceptional 20.3% |
| Immigrants | Sweden | 100.0 /100 | #24 | Exceptional 20.3% |
| Immigrants | Japan | 100.0 /100 | #25 | Exceptional 20.0% |
| Cambodians | 100.0 /100 | #26 | Exceptional 20.0% |
| Immigrants | Sri Lanka | 100.0 /100 | #27 | Exceptional 19.9% |
| Turks | 100.0 /100 | #28 | Exceptional 19.9% |
| Latvians | 100.0 /100 | #29 | Exceptional 19.8% |
| Immigrants | Turkey | 100.0 /100 | #30 | Exceptional 19.7% |
| Immigrants | Korea | 100.0 /100 | #31 | Exceptional 19.7% |