Immigrants from Korea vs Immigrants from Sweden Master's Degree
COMPARE
Immigrants from Korea
Immigrants from Sweden
Master's Degree
Master's Degree Comparison
Immigrants from Korea
Immigrants from Sweden
19.7%
MASTER'S DEGREE
100.0/ 100
METRIC RATING
31st/ 347
METRIC RANK
20.3%
MASTER'S DEGREE
100.0/ 100
METRIC RATING
24th/ 347
METRIC RANK
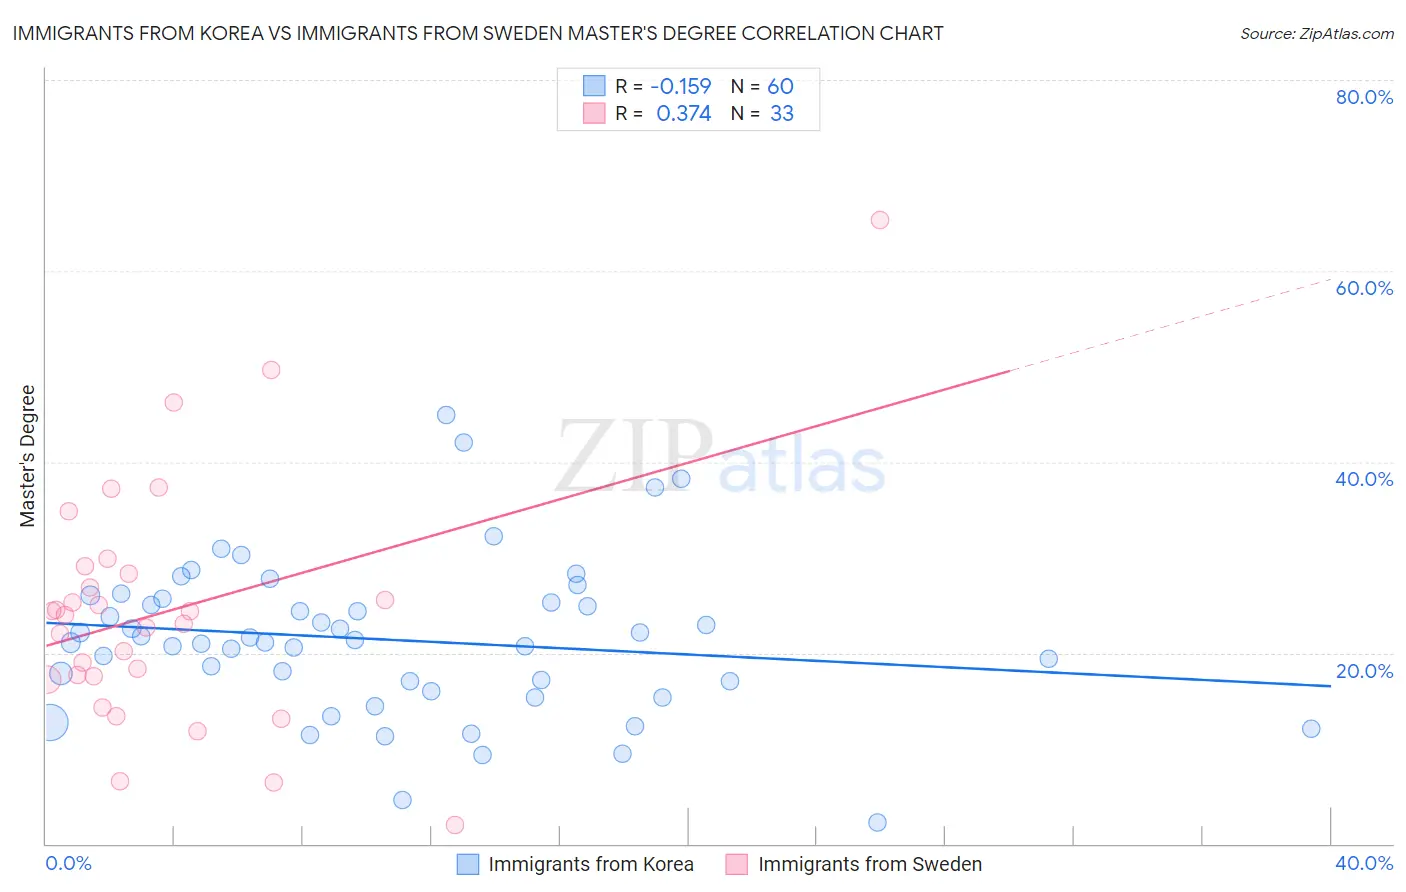
Immigrants from Korea vs Immigrants from Sweden Master's Degree Correlation Chart
The statistical analysis conducted on geographies consisting of 416,166,460 people shows a poor negative correlation between the proportion of Immigrants from Korea and percentage of population with at least master's degree education in the United States with a correlation coefficient (R) of -0.159 and weighted average of 19.7%. Similarly, the statistical analysis conducted on geographies consisting of 164,715,920 people shows a mild positive correlation between the proportion of Immigrants from Sweden and percentage of population with at least master's degree education in the United States with a correlation coefficient (R) of 0.374 and weighted average of 20.3%, a difference of 2.8%.
Master's Degree Correlation Summary
| Measurement | Immigrants from Korea | Immigrants from Sweden |
| Minimum | 2.3% | 2.0% |
| Maximum | 45.0% | 65.4% |
| Range | 42.7% | 63.4% |
| Mean | 21.4% | 24.3% |
| Median | 21.2% | 24.0% |
| Interquartile 25% (IQ1) | 16.5% | 17.3% |
| Interquartile 75% (IQ3) | 25.4% | 28.6% |
| Interquartile Range (IQR) | 9.0% | 11.3% |
| Standard Deviation (Sample) | 8.2% | 12.7% |
| Standard Deviation (Population) | 8.1% | 12.5% |
Demographics Similar to Immigrants from Korea and Immigrants from Sweden by Master's Degree
In terms of master's degree, the demographic groups most similar to Immigrants from Korea are Immigrants from Turkey (19.7%, a difference of 0.010%), Burmese (19.7%, a difference of 0.070%), Latvian (19.8%, a difference of 0.52%), Russian (19.5%, a difference of 0.85%), and Immigrants from Denmark (19.5%, a difference of 0.88%). Similarly, the demographic groups most similar to Immigrants from Sweden are Immigrants from France (20.3%, a difference of 0.070%), Israeli (20.3%, a difference of 0.35%), Immigrants from Ireland (20.4%, a difference of 0.77%), Indian (Asian) (20.5%, a difference of 0.88%), and Immigrants from Hong Kong (20.5%, a difference of 0.90%).
| Demographics | Rating | Rank | Master's Degree |
| Immigrants | South Central Asia | 100.0 /100 | #17 | Exceptional 20.7% |
| Soviet Union | 100.0 /100 | #18 | Exceptional 20.5% |
| Immigrants | Hong Kong | 100.0 /100 | #19 | Exceptional 20.5% |
| Indians (Asian) | 100.0 /100 | #20 | Exceptional 20.5% |
| Immigrants | Ireland | 100.0 /100 | #21 | Exceptional 20.4% |
| Israelis | 100.0 /100 | #22 | Exceptional 20.3% |
| Immigrants | France | 100.0 /100 | #23 | Exceptional 20.3% |
| Immigrants | Sweden | 100.0 /100 | #24 | Exceptional 20.3% |
| Immigrants | Japan | 100.0 /100 | #25 | Exceptional 20.0% |
| Cambodians | 100.0 /100 | #26 | Exceptional 20.0% |
| Immigrants | Sri Lanka | 100.0 /100 | #27 | Exceptional 19.9% |
| Turks | 100.0 /100 | #28 | Exceptional 19.9% |
| Latvians | 100.0 /100 | #29 | Exceptional 19.8% |
| Immigrants | Turkey | 100.0 /100 | #30 | Exceptional 19.7% |
| Immigrants | Korea | 100.0 /100 | #31 | Exceptional 19.7% |
| Burmese | 100.0 /100 | #32 | Exceptional 19.7% |
| Russians | 100.0 /100 | #33 | Exceptional 19.5% |
| Immigrants | Denmark | 100.0 /100 | #34 | Exceptional 19.5% |
| Immigrants | Northern Europe | 100.0 /100 | #35 | Exceptional 19.5% |
| Immigrants | Russia | 100.0 /100 | #36 | Exceptional 19.4% |
| Mongolians | 100.0 /100 | #37 | Exceptional 19.4% |