Tlingit-Haida vs Thai Master's Degree
COMPARE
Tlingit-Haida
Thai
Master's Degree
Master's Degree Comparison
Tlingit-Haida
Thais
12.8%
MASTER'S DEGREE
1.3/ 100
METRIC RATING
251st/ 347
METRIC RANK
21.7%
MASTER'S DEGREE
100.0/ 100
METRIC RATING
9th/ 347
METRIC RANK
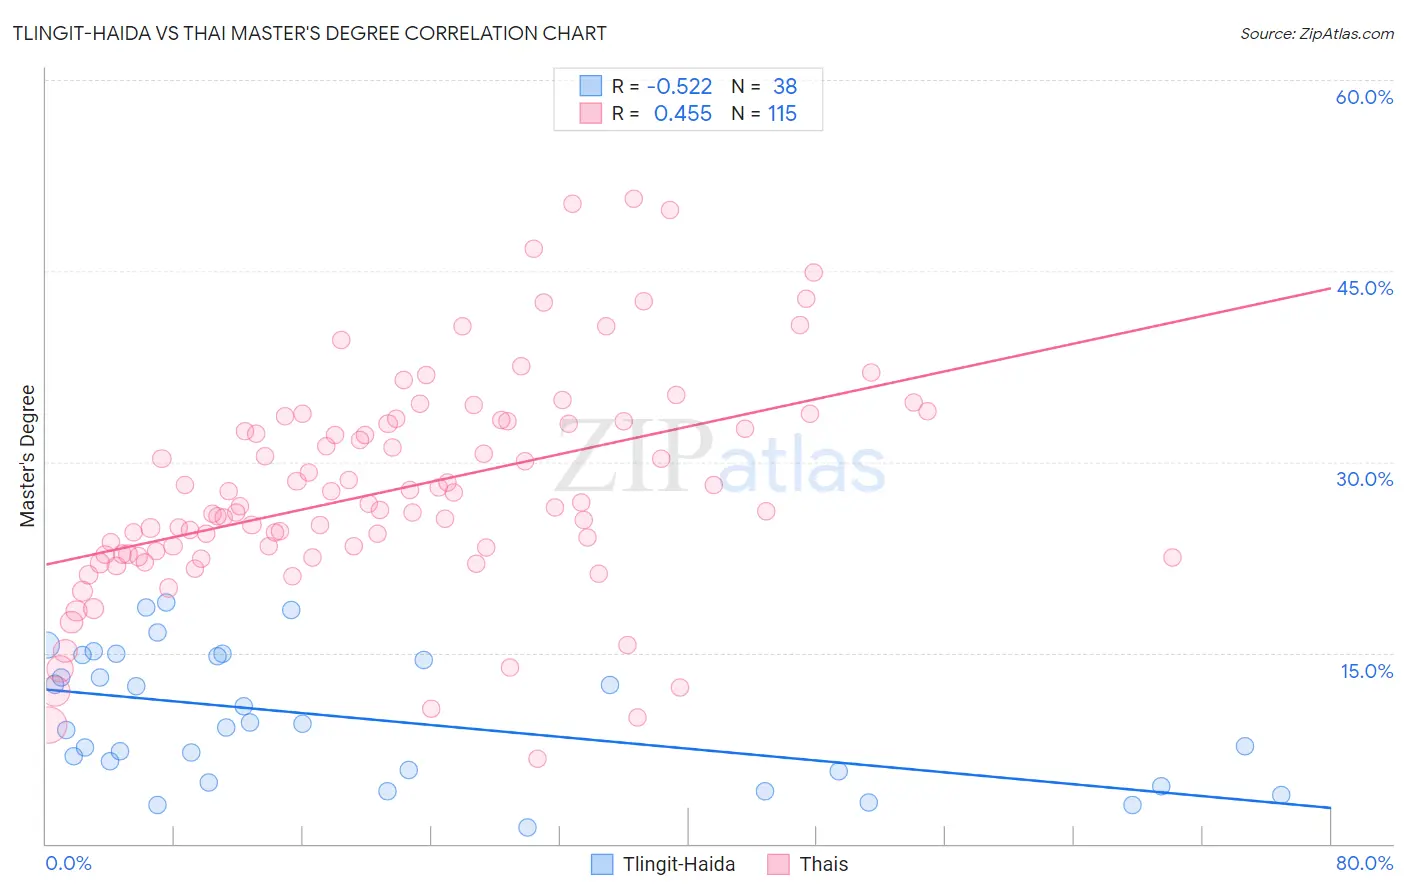
Tlingit-Haida vs Thai Master's Degree Correlation Chart
The statistical analysis conducted on geographies consisting of 60,869,548 people shows a substantial negative correlation between the proportion of Tlingit-Haida and percentage of population with at least master's degree education in the United States with a correlation coefficient (R) of -0.522 and weighted average of 12.8%. Similarly, the statistical analysis conducted on geographies consisting of 475,625,937 people shows a moderate positive correlation between the proportion of Thais and percentage of population with at least master's degree education in the United States with a correlation coefficient (R) of 0.455 and weighted average of 21.7%, a difference of 69.1%.
Master's Degree Correlation Summary
| Measurement | Tlingit-Haida | Thai |
| Minimum | 1.3% | 6.7% |
| Maximum | 18.9% | 50.7% |
| Range | 17.7% | 44.0% |
| Mean | 9.9% | 27.8% |
| Median | 9.3% | 26.5% |
| Interquartile 25% (IQ1) | 5.7% | 22.7% |
| Interquartile 75% (IQ3) | 14.7% | 33.2% |
| Interquartile Range (IQR) | 8.9% | 10.4% |
| Standard Deviation (Sample) | 5.1% | 8.5% |
| Standard Deviation (Population) | 5.0% | 8.5% |
Similar Demographics by Master's Degree
Demographics Similar to Tlingit-Haida by Master's Degree
In terms of master's degree, the demographic groups most similar to Tlingit-Haida are Liberian (12.8%, a difference of 0.030%), Cree (12.8%, a difference of 0.040%), African (12.9%, a difference of 0.35%), Iroquois (12.9%, a difference of 0.43%), and Immigrants from Cambodia (12.9%, a difference of 0.47%).
| Demographics | Rating | Rank | Master's Degree |
| Delaware | 1.7 /100 | #244 | Tragic 13.0% |
| Immigrants | Bahamas | 1.4 /100 | #245 | Tragic 12.9% |
| Immigrants | Cambodia | 1.4 /100 | #246 | Tragic 12.9% |
| Iroquois | 1.4 /100 | #247 | Tragic 12.9% |
| Africans | 1.4 /100 | #248 | Tragic 12.9% |
| Cree | 1.3 /100 | #249 | Tragic 12.8% |
| Liberians | 1.3 /100 | #250 | Tragic 12.8% |
| Tlingit-Haida | 1.3 /100 | #251 | Tragic 12.8% |
| French American Indians | 1.0 /100 | #252 | Tragic 12.7% |
| Immigrants | Dominica | 0.8 /100 | #253 | Tragic 12.6% |
| Indonesians | 0.8 /100 | #254 | Tragic 12.6% |
| Immigrants | Congo | 0.8 /100 | #255 | Tragic 12.6% |
| Immigrants | Portugal | 0.8 /100 | #256 | Tragic 12.6% |
| Osage | 0.7 /100 | #257 | Tragic 12.6% |
| Immigrants | Liberia | 0.6 /100 | #258 | Tragic 12.5% |
Demographics Similar to Thais by Master's Degree
In terms of master's degree, the demographic groups most similar to Thais are Cypriot (21.8%, a difference of 0.34%), Immigrants from Iran (21.6%, a difference of 0.41%), Immigrants from China (21.2%, a difference of 2.5%), Iranian (22.3%, a difference of 2.5%), and Immigrants from India (22.3%, a difference of 2.8%).
| Demographics | Rating | Rank | Master's Degree |
| Filipinos | 100.0 /100 | #2 | Exceptional 23.4% |
| Immigrants | Israel | 100.0 /100 | #3 | Exceptional 22.6% |
| Okinawans | 100.0 /100 | #4 | Exceptional 22.6% |
| Immigrants | Taiwan | 100.0 /100 | #5 | Exceptional 22.5% |
| Immigrants | India | 100.0 /100 | #6 | Exceptional 22.3% |
| Iranians | 100.0 /100 | #7 | Exceptional 22.3% |
| Cypriots | 100.0 /100 | #8 | Exceptional 21.8% |
| Thais | 100.0 /100 | #9 | Exceptional 21.7% |
| Immigrants | Iran | 100.0 /100 | #10 | Exceptional 21.6% |
| Immigrants | China | 100.0 /100 | #11 | Exceptional 21.2% |
| Eastern Europeans | 100.0 /100 | #12 | Exceptional 21.1% |
| Immigrants | Australia | 100.0 /100 | #13 | Exceptional 20.9% |
| Immigrants | Switzerland | 100.0 /100 | #14 | Exceptional 20.9% |
| Immigrants | Eastern Asia | 100.0 /100 | #15 | Exceptional 20.8% |
| Immigrants | Belgium | 100.0 /100 | #16 | Exceptional 20.8% |