Dutch vs Immigrants from Sweden Master's Degree
COMPARE
Dutch
Immigrants from Sweden
Master's Degree
Master's Degree Comparison
Dutch
Immigrants from Sweden
13.8%
MASTER'S DEGREE
8.7/ 100
METRIC RATING
230th/ 347
METRIC RANK
20.3%
MASTER'S DEGREE
100.0/ 100
METRIC RATING
24th/ 347
METRIC RANK
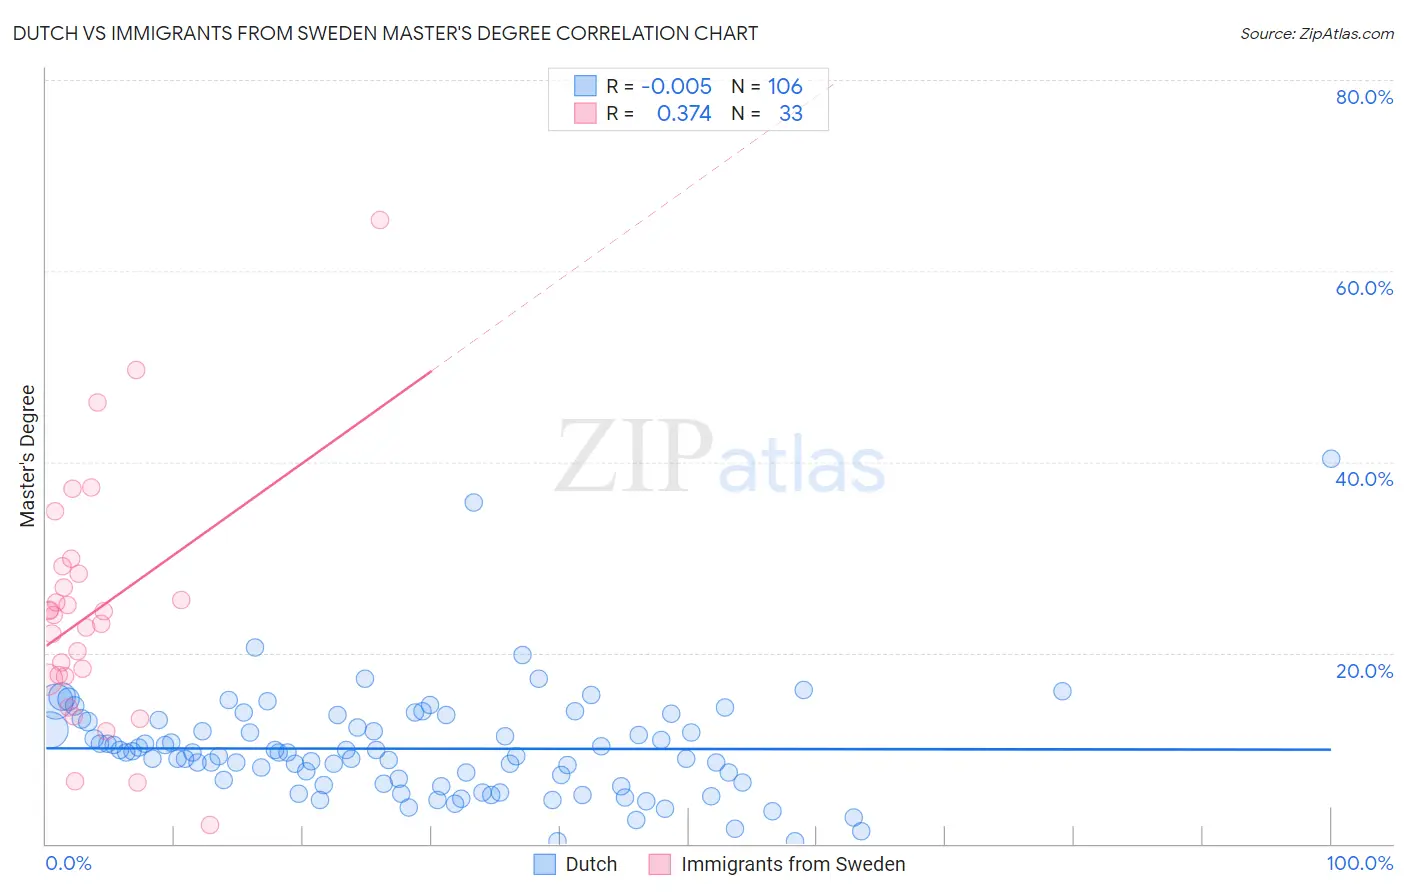
Dutch vs Immigrants from Sweden Master's Degree Correlation Chart
The statistical analysis conducted on geographies consisting of 553,710,662 people shows no correlation between the proportion of Dutch and percentage of population with at least master's degree education in the United States with a correlation coefficient (R) of -0.005 and weighted average of 13.8%. Similarly, the statistical analysis conducted on geographies consisting of 164,715,920 people shows a mild positive correlation between the proportion of Immigrants from Sweden and percentage of population with at least master's degree education in the United States with a correlation coefficient (R) of 0.374 and weighted average of 20.3%, a difference of 46.9%.
Master's Degree Correlation Summary
| Measurement | Dutch | Immigrants from Sweden |
| Minimum | 0.26% | 2.0% |
| Maximum | 40.4% | 65.4% |
| Range | 40.1% | 63.4% |
| Mean | 10.0% | 24.3% |
| Median | 9.5% | 24.0% |
| Interquartile 25% (IQ1) | 6.3% | 17.3% |
| Interquartile 75% (IQ3) | 12.8% | 28.6% |
| Interquartile Range (IQR) | 6.5% | 11.3% |
| Standard Deviation (Sample) | 5.7% | 12.7% |
| Standard Deviation (Population) | 5.7% | 12.5% |
Similar Demographics by Master's Degree
Demographics Similar to Dutch by Master's Degree
In terms of master's degree, the demographic groups most similar to Dutch are British West Indian (13.8%, a difference of 0.030%), White/Caucasian (13.8%, a difference of 0.14%), Immigrants from West Indies (13.9%, a difference of 0.45%), Guyanese (13.7%, a difference of 0.55%), and Immigrants from St. Vincent and the Grenadines (13.9%, a difference of 0.89%).
| Demographics | Rating | Rank | Master's Degree |
| Immigrants | South Eastern Asia | 11.9 /100 | #223 | Poor 14.0% |
| Immigrants | Grenada | 11.8 /100 | #224 | Poor 14.0% |
| Portuguese | 11.2 /100 | #225 | Poor 13.9% |
| Immigrants | St. Vincent and the Grenadines | 11.0 /100 | #226 | Poor 13.9% |
| Immigrants | West Indies | 9.8 /100 | #227 | Tragic 13.9% |
| Whites/Caucasians | 9.1 /100 | #228 | Tragic 13.8% |
| British West Indians | 8.8 /100 | #229 | Tragic 13.8% |
| Dutch | 8.7 /100 | #230 | Tragic 13.8% |
| Guyanese | 7.6 /100 | #231 | Tragic 13.7% |
| Immigrants | Philippines | 6.0 /100 | #232 | Tragic 13.6% |
| Immigrants | Ecuador | 5.7 /100 | #233 | Tragic 13.6% |
| Immigrants | Burma/Myanmar | 5.0 /100 | #234 | Tragic 13.5% |
| German Russians | 4.5 /100 | #235 | Tragic 13.5% |
| Immigrants | Guyana | 4.4 /100 | #236 | Tragic 13.4% |
| Jamaicans | 4.1 /100 | #237 | Tragic 13.4% |
Demographics Similar to Immigrants from Sweden by Master's Degree
In terms of master's degree, the demographic groups most similar to Immigrants from Sweden are Immigrants from France (20.3%, a difference of 0.070%), Israeli (20.3%, a difference of 0.35%), Immigrants from Ireland (20.4%, a difference of 0.77%), Indian (Asian) (20.5%, a difference of 0.88%), and Immigrants from Hong Kong (20.5%, a difference of 0.90%).
| Demographics | Rating | Rank | Master's Degree |
| Immigrants | South Central Asia | 100.0 /100 | #17 | Exceptional 20.7% |
| Soviet Union | 100.0 /100 | #18 | Exceptional 20.5% |
| Immigrants | Hong Kong | 100.0 /100 | #19 | Exceptional 20.5% |
| Indians (Asian) | 100.0 /100 | #20 | Exceptional 20.5% |
| Immigrants | Ireland | 100.0 /100 | #21 | Exceptional 20.4% |
| Israelis | 100.0 /100 | #22 | Exceptional 20.3% |
| Immigrants | France | 100.0 /100 | #23 | Exceptional 20.3% |
| Immigrants | Sweden | 100.0 /100 | #24 | Exceptional 20.3% |
| Immigrants | Japan | 100.0 /100 | #25 | Exceptional 20.0% |
| Cambodians | 100.0 /100 | #26 | Exceptional 20.0% |
| Immigrants | Sri Lanka | 100.0 /100 | #27 | Exceptional 19.9% |
| Turks | 100.0 /100 | #28 | Exceptional 19.9% |
| Latvians | 100.0 /100 | #29 | Exceptional 19.8% |
| Immigrants | Turkey | 100.0 /100 | #30 | Exceptional 19.7% |
| Immigrants | Korea | 100.0 /100 | #31 | Exceptional 19.7% |