Tlingit-Haida vs Immigrants from Armenia Doctorate Degree

COMPARE

Tlingit-Haida
Race
Ancestry
AfghanAfricanAlaska NativeAlaskan AthabascanAlbanianAleutAlsatianAmericanApacheArabArapahoArgentineanArmenianAssyrian/Chaldean/SyriacAustralianAustrianBahamianBangladeshiBarbadianBasqueBelgianBelizeanBermudanBhutaneseBlackfeetBolivianBrazilianBritishBritish West IndianBulgarianBurmeseCajunCambodianCanadianCape VerdeanCarpatho RusynCelticCentral AmericanCentral American IndianCherokeeCheyenneChickasawChileanChineseChippewaChoctawColombianColvilleComancheCosta RicanCreeCreekCroatianCrowCubanCypriotCzechCzechoslovakianDanishDelawareDominicanDutchDutch West IndianEastern EuropeanEcuadorianEgyptianEnglishEstonianEthiopianEuropeanFijianFilipinoFinnishFrenchFrench American IndianFrench CanadianGermanGerman RussianGhanaianGreekGuamanian/ChamorroGuatemalanGuyaneseHaitianHmongHonduranHopiHoumaHungarianIcelanderIndian (Asian)IndonesianInupiatIranianIraqiIrishIroquoisIsraeliItalianJamaicanJapaneseJordanianKenyanKiowaKoreanLaotianLatvianLebaneseLiberianLithuanianLumbeeLuxembourgerMacedonianMalaysianMalteseMarshalleseMenomineeMexicanMexican American IndianMongolianMoroccanNative HawaiianNavajoNepaleseNew ZealanderNicaraguanNigerianNorthern EuropeanNorwegianOkinawanOsageOttawaPaiutePakistaniPalestinianPanamanianParaguayanPennsylvania GermanPeruvianPimaPolishPortuguesePotawatomiPuebloPuerto RicanPuget Sound SalishRomanianRussianSalvadoranSamoanScandinavianScotch-IrishScottishSeminoleSenegaleseSerbianShoshoneSierra LeoneanSiouxSlavicSlovakSloveneSomaliSouth AfricanSouth AmericanSouth American IndianSoviet UnionSpaniardSpanishSpanish AmericanSpanish American IndianSri LankanSubsaharan AfricanSudaneseSwedishSwissSyrianTaiwaneseThaiTlingit-HaidaTohono O'OdhamTonganTrinidadian and TobagonianTsimshianTurkishU.S. Virgin IslanderUgandanUkrainianUruguayanUteVenezuelanVietnameseWelshWest IndianYakamaYaquiYugoslavianYumanYup'ikZimbabwean
Immigration
NonimmigrantsImmigrantsAfghanistanAfricaAlbaniaArgentinaAsiaAustraliaAustriaBahamasBangladeshBarbadosBelarusBelgiumBelizeBoliviaBosnia and HerzegovinaBrazilBulgariaBurma/MyanmarCabo VerdeCambodiaCameroonCanadaCaribbeanCentral AmericaChileChinaColombiaCongoCosta RicaCroatiaCubaCzechoslovakiaDenmarkDominicaDominican RepublicEastern AfricaEastern AsiaEastern EuropeEcuadorEgyptEl SalvadorEnglandEritreaEthiopiaEuropeFijiFranceGermanyGhanaGreeceGrenadaGuatemalaGuyanaHaitiHondurasHong KongHungaryIndiaIndonesiaIranIraqIrelandIsraelItalyJamaicaJapanJordanKazakhstanKenyaKoreaKuwaitLaosLatin AmericaLatviaLebanonLiberiaLithuaniaMalaysiaMexicoMicronesiaMiddle AfricaMoldovaMoroccoNepalNetherlandsNicaraguaNigeriaNorth AmericaNorth MacedoniaNorthern AfricaNorthern EuropeNorwayOceaniaPakistanPanamaPeruPhilippinesPolandPortugalRomaniaRussiaSaudi ArabiaScotlandSenegalSerbiaSierra LeoneSingaporeSomaliaSouth AfricaSouth AmericaSouth Central AsiaSouth Eastern AsiaSouthern EuropeSpainSri LankaSt. Vincent and the GrenadinesSudanSwedenSwitzerlandSyriaTaiwanThailandTrinidad and TobagoTurkeyUgandaUkraineUruguayUzbekistanVenezuelaVietnamWest IndiesWestern AfricaWestern AsiaWestern EuropeYemenZaireZimbabweAzores
Immigrants from Armenia
Race
Ancestry
AfghanAfricanAlaska NativeAlaskan AthabascanAlbanianAleutAlsatianAmericanApacheArabArapahoArgentineanArmenianAssyrian/Chaldean/SyriacAustralianAustrianBahamianBangladeshiBarbadianBasqueBelgianBelizeanBermudanBhutaneseBlackfeetBolivianBrazilianBritishBritish West IndianBulgarianBurmeseCajunCambodianCanadianCape VerdeanCarpatho RusynCelticCentral AmericanCentral American IndianCherokeeCheyenneChickasawChileanChineseChippewaChoctawColombianColvilleComancheCosta RicanCreeCreekCroatianCrowCubanCypriotCzechCzechoslovakianDanishDelawareDominicanDutchDutch West IndianEastern EuropeanEcuadorianEgyptianEnglishEstonianEthiopianEuropeanFijianFilipinoFinnishFrenchFrench American IndianFrench CanadianGermanGerman RussianGhanaianGreekGuamanian/ChamorroGuatemalanGuyaneseHaitianHmongHonduranHopiHoumaHungarianIcelanderIndian (Asian)IndonesianInupiatIranianIraqiIrishIroquoisIsraeliItalianJamaicanJapaneseJordanianKenyanKiowaKoreanLaotianLatvianLebaneseLiberianLithuanianLumbeeLuxembourgerMacedonianMalaysianMalteseMarshalleseMenomineeMexicanMexican American IndianMongolianMoroccanNative HawaiianNavajoNepaleseNew ZealanderNicaraguanNigerianNorthern EuropeanNorwegianOkinawanOsageOttawaPaiutePakistaniPalestinianPanamanianParaguayanPennsylvania GermanPeruvianPimaPolishPortuguesePotawatomiPuebloPuerto RicanPuget Sound SalishRomanianRussianSalvadoranSamoanScandinavianScotch-IrishScottishSeminoleSenegaleseSerbianShoshoneSierra LeoneanSiouxSlavicSlovakSloveneSomaliSouth AfricanSouth AmericanSouth American IndianSoviet UnionSpaniardSpanishSpanish AmericanSpanish American IndianSri LankanSubsaharan AfricanSudaneseSwedishSwissSyrianTaiwaneseThaiTohono O'OdhamTonganTrinidadian and TobagonianTsimshianTurkishU.S. Virgin IslanderUgandanUkrainianUruguayanUteVenezuelanVietnameseWelshWest IndianYakamaYaquiYugoslavianYumanYup'ikZimbabwean
Immigration
NonimmigrantsImmigrantsAfghanistanAfricaAlbaniaArgentinaArmeniaAsiaAustraliaAustriaBahamasBangladeshBarbadosBelarusBelgiumBelizeBoliviaBosnia and HerzegovinaBrazilBulgariaBurma/MyanmarCabo VerdeCambodiaCameroonCanadaCaribbeanCentral AmericaChileChinaColombiaCongoCosta RicaCroatiaCubaCzechoslovakiaDenmarkDominicaDominican RepublicEastern AfricaEastern AsiaEastern EuropeEcuadorEgyptEl SalvadorEnglandEritreaEthiopiaEuropeFijiFranceGermanyGhanaGreeceGrenadaGuatemalaGuyanaHaitiHondurasHong KongHungaryIndiaIndonesiaIranIraqIrelandIsraelItalyJamaicaJapanJordanKazakhstanKenyaKoreaKuwaitLaosLatin AmericaLatviaLebanonLiberiaLithuaniaMalaysiaMexicoMicronesiaMiddle AfricaMoldovaMoroccoNepalNetherlandsNicaraguaNigeriaNorth AmericaNorth MacedoniaNorthern AfricaNorthern EuropeNorwayOceaniaPakistanPanamaPeruPhilippinesPolandPortugalRomaniaRussiaSaudi ArabiaScotlandSenegalSerbiaSierra LeoneSingaporeSomaliaSouth AfricaSouth AmericaSouth Central AsiaSouth Eastern AsiaSouthern EuropeSpainSri LankaSt. Vincent and the GrenadinesSudanSwedenSwitzerlandSyriaTaiwanThailandTrinidad and TobagoTurkeyUgandaUkraineUruguayUzbekistanVenezuelaVietnamWest IndiesWestern AfricaWestern AsiaWestern EuropeYemenZaireZimbabweAzores
Doctorate Degree
Income
Poverty
Unemployment
Labor Participation
Family Structure
Vehicle Availability
Education Level
Disability

Doctorate Degree Comparison

Tlingit-Haida

Immigrants from Armenia

Poor
Poor
1.7%
DOCTORATE DEGREE
11.9/ 100
METRIC RATING
218th/ 347
METRIC RANK
1.7%
DOCTORATE DEGREE
15.1/ 100
METRIC RATING
211th/ 347
METRIC RANK

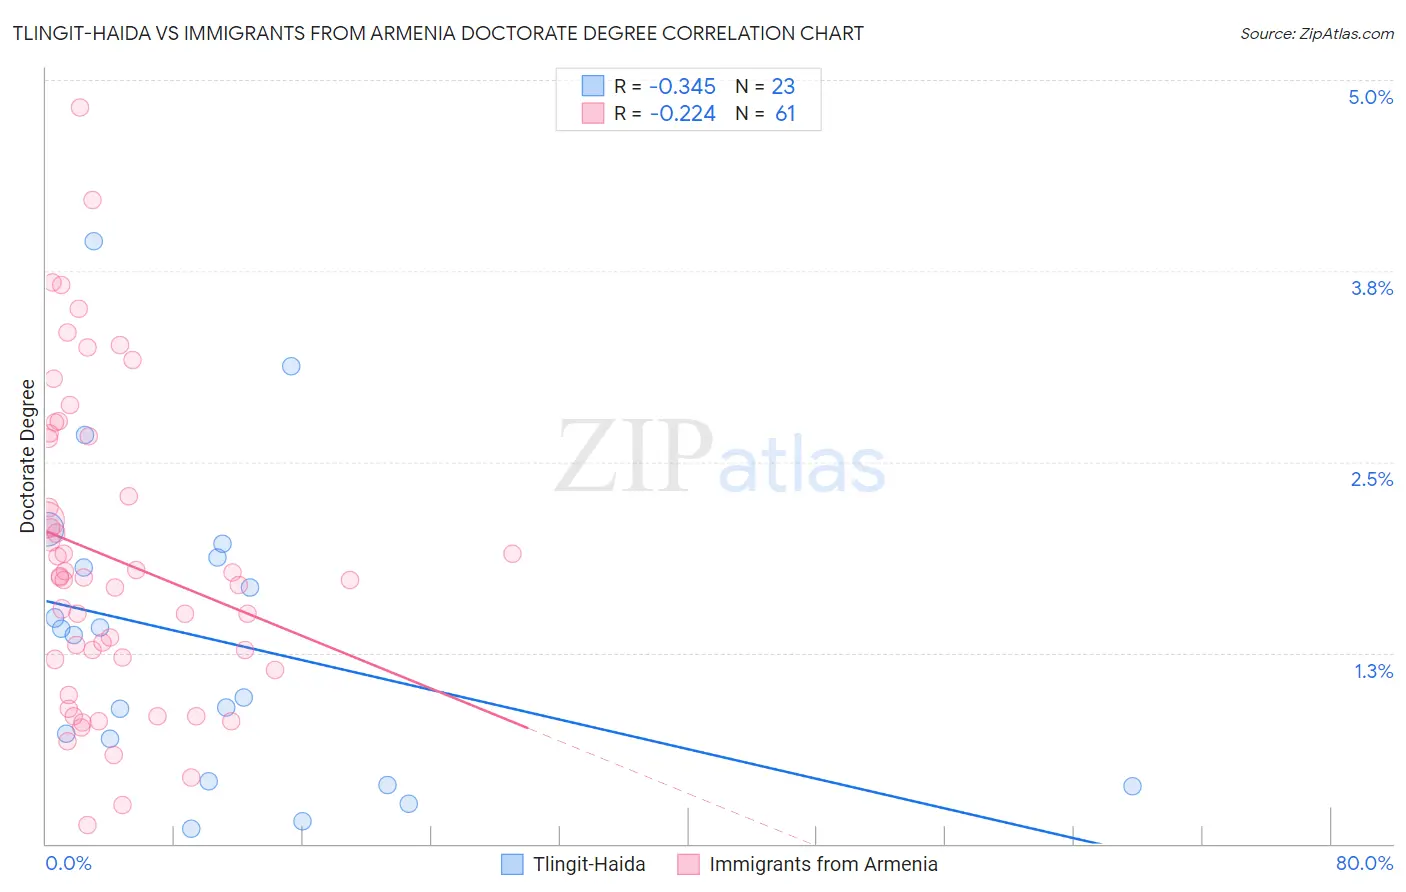
Tlingit-Haida vs Immigrants from Armenia Doctorate Degree Correlation Chart

The statistical analysis conducted on geographies consisting of 60,593,373 people shows a mild negative correlation between the proportion of Tlingit-Haida and percentage of population with at least doctorate degree education in the United States with a correlation coefficient (R) of -0.345 and weighted average of 1.7%. Similarly, the statistical analysis conducted on geographies consisting of 97,532,084 people shows a weak negative correlation between the proportion of Immigrants from Armenia and percentage of population with at least doctorate degree education in the United States with a correlation coefficient (R) of -0.224 and weighted average of 1.7%, a difference of 1.1%.
Tlingit-Haida vs Immigrants from Armenia Doctorate Degree

Doctorate Degree Correlation Summary

MeasurementTlingit-HaidaImmigrants from Armenia
Minimum0.099%0.12%
Maximum3.9%4.8%
Range3.8%4.7%
Mean1.3%1.9%
Median1.4%1.7%
Interquartile 25% (IQ1)0.41%1.2%
Interquartile 75% (IQ3)1.9%2.7%
Interquartile Range (IQR)1.5%1.5%
Standard Deviation (Sample)0.99%1.0%
Standard Deviation (Population)0.97%1.0%

Demographics Similar to Tlingit-Haida and Immigrants from Armenia by Doctorate Degree

In terms of doctorate degree, the demographic groups most similar to Tlingit-Haida are Spanish American (1.7%, a difference of 0.37%), Immigrants from Iraq (1.7%, a difference of 0.46%), Immigrants from Burma/Myanmar (1.7%, a difference of 0.58%), Alaskan Athabascan (1.7%, a difference of 0.68%), and Pueblo (1.7%, a difference of 0.82%). Similarly, the demographic groups most similar to Immigrants from Armenia are Tongan (1.7%, a difference of 0.010%), Immigrants from Western Africa (1.7%, a difference of 0.10%), Immigrants from South Eastern Asia (1.7%, a difference of 0.13%), Korean (1.7%, a difference of 0.27%), and Pueblo (1.7%, a difference of 0.28%).
DemographicsRating | RankDoctorate Degree
Somalis
21.2
/100
|
#204
Fair
1.7%
Venezuelans
19.5
/100
|
#205
Poor
1.7%
Immigrants | Peru
17.6
/100
|
#206
Poor
1.7%
Yugoslavians
17.1
/100
|
#207
Poor
1.7%
Colombians
16.1
/100
|
#208
Poor
1.7%
Immigrants | Western Africa
15.4
/100
|
#209
Poor
1.7%
Tongans
15.1
/100
|
#210
Poor
1.7%
Immigrants | Armenia
15.1
/100
|
#211
Poor
1.7%
Immigrants | South Eastern Asia
14.7
/100
|
#212
Poor
1.7%
Koreans
14.2
/100
|
#213
Poor
1.7%
Pueblo
14.2
/100
|
#214
Poor
1.7%
Alaskan Athabascans
13.8
/100
|
#215
Poor
1.7%
Immigrants | Burma/Myanmar
13.5
/100
|
#216
Poor
1.7%
Spanish Americans
12.9
/100
|
#217
Poor
1.7%
Tlingit-Haida
11.9
/100
|
#218
Poor
1.7%
Immigrants | Iraq
10.7
/100
|
#219
Poor
1.7%
Immigrants | Uruguay
9.2
/100
|
#220
Tragic
1.7%
Immigrants | Nonimmigrants
8.8
/100
|
#221
Tragic
1.7%
Immigrants | Venezuela
8.7
/100
|
#222
Tragic
1.7%
Immigrants | Bosnia and Herzegovina
7.8
/100
|
#223
Tragic
1.7%
Immigrants | Poland
7.4
/100
|
#224
Tragic
1.7%