Tlingit-Haida vs Immigrants from Honduras Doctorate Degree
COMPARE
Tlingit-Haida
Immigrants from Honduras
Doctorate Degree
Doctorate Degree Comparison
Tlingit-Haida
Immigrants from Honduras
1.7%
DOCTORATE DEGREE
11.9/ 100
METRIC RATING
218th/ 347
METRIC RANK
1.4%
DOCTORATE DEGREE
0.1/ 100
METRIC RATING
311th/ 347
METRIC RANK
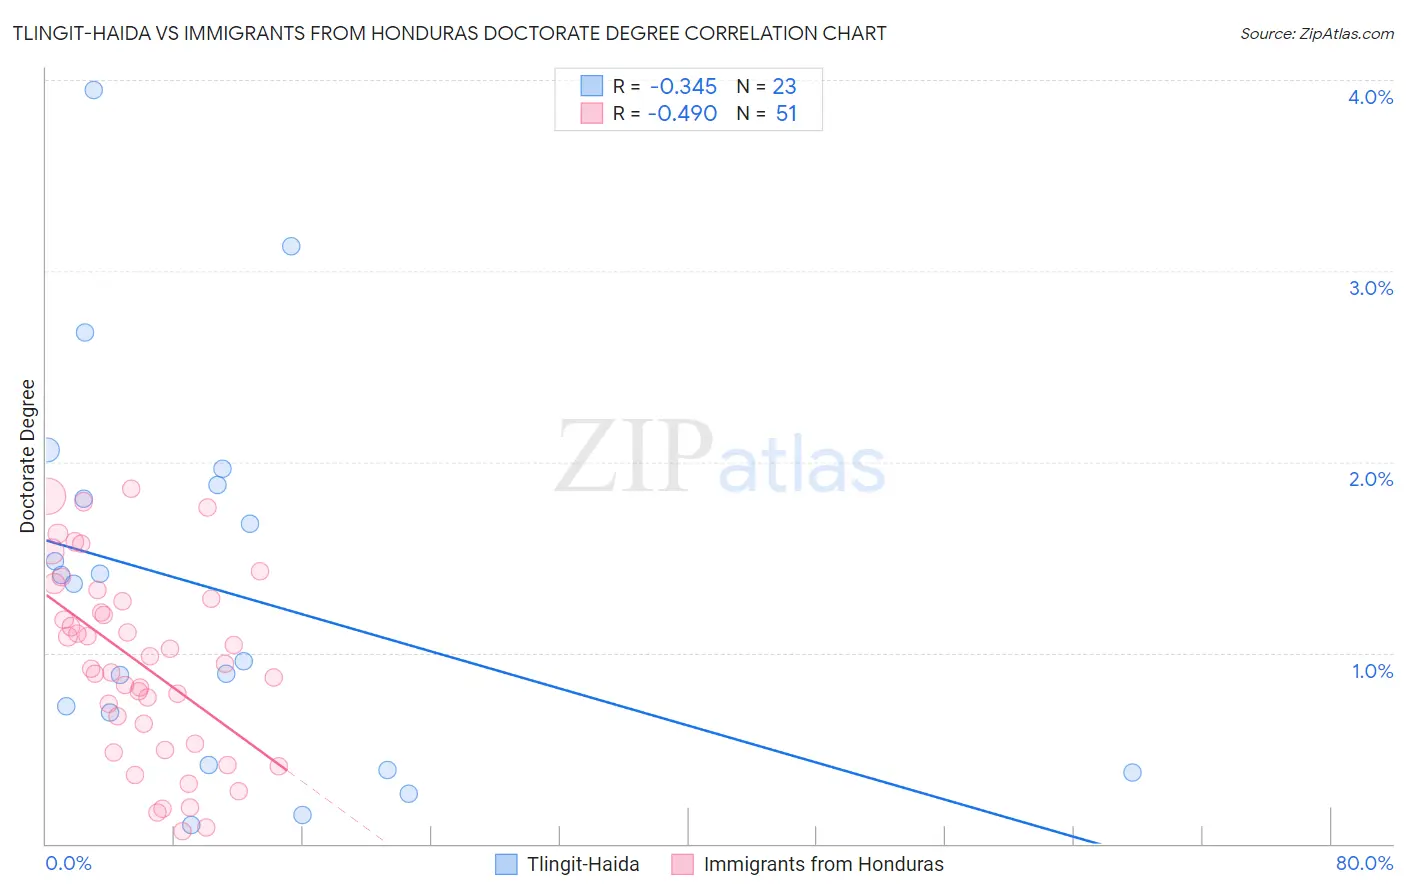
Tlingit-Haida vs Immigrants from Honduras Doctorate Degree Correlation Chart
The statistical analysis conducted on geographies consisting of 60,593,373 people shows a mild negative correlation between the proportion of Tlingit-Haida and percentage of population with at least doctorate degree education in the United States with a correlation coefficient (R) of -0.345 and weighted average of 1.7%. Similarly, the statistical analysis conducted on geographies consisting of 318,827,529 people shows a moderate negative correlation between the proportion of Immigrants from Honduras and percentage of population with at least doctorate degree education in the United States with a correlation coefficient (R) of -0.490 and weighted average of 1.4%, a difference of 24.9%.
Doctorate Degree Correlation Summary
| Measurement | Tlingit-Haida | Immigrants from Honduras |
| Minimum | 0.099% | 0.068% |
| Maximum | 3.9% | 1.9% |
| Range | 3.8% | 1.8% |
| Mean | 1.3% | 0.95% |
| Median | 1.4% | 0.94% |
| Interquartile 25% (IQ1) | 0.41% | 0.52% |
| Interquartile 75% (IQ3) | 1.9% | 1.3% |
| Interquartile Range (IQR) | 1.5% | 0.76% |
| Standard Deviation (Sample) | 0.99% | 0.49% |
| Standard Deviation (Population) | 0.97% | 0.48% |
Similar Demographics by Doctorate Degree
Demographics Similar to Tlingit-Haida by Doctorate Degree
In terms of doctorate degree, the demographic groups most similar to Tlingit-Haida are Spanish American (1.7%, a difference of 0.37%), Immigrants from Iraq (1.7%, a difference of 0.46%), Immigrants from Burma/Myanmar (1.7%, a difference of 0.58%), Alaskan Athabascan (1.7%, a difference of 0.68%), and Pueblo (1.7%, a difference of 0.82%).
| Demographics | Rating | Rank | Doctorate Degree |
| Immigrants | Armenia | 15.1 /100 | #211 | Poor 1.7% |
| Immigrants | South Eastern Asia | 14.7 /100 | #212 | Poor 1.7% |
| Koreans | 14.2 /100 | #213 | Poor 1.7% |
| Pueblo | 14.2 /100 | #214 | Poor 1.7% |
| Alaskan Athabascans | 13.8 /100 | #215 | Poor 1.7% |
| Immigrants | Burma/Myanmar | 13.5 /100 | #216 | Poor 1.7% |
| Spanish Americans | 12.9 /100 | #217 | Poor 1.7% |
| Tlingit-Haida | 11.9 /100 | #218 | Poor 1.7% |
| Immigrants | Iraq | 10.7 /100 | #219 | Poor 1.7% |
| Immigrants | Uruguay | 9.2 /100 | #220 | Tragic 1.7% |
| Immigrants | Nonimmigrants | 8.8 /100 | #221 | Tragic 1.7% |
| Immigrants | Venezuela | 8.7 /100 | #222 | Tragic 1.7% |
| Immigrants | Bosnia and Herzegovina | 7.8 /100 | #223 | Tragic 1.7% |
| Immigrants | Poland | 7.4 /100 | #224 | Tragic 1.7% |
| Immigrants | Colombia | 6.7 /100 | #225 | Tragic 1.7% |
Demographics Similar to Immigrants from Honduras by Doctorate Degree
In terms of doctorate degree, the demographic groups most similar to Immigrants from Honduras are Immigrants from Jamaica (1.4%, a difference of 0.18%), Immigrants from Nicaragua (1.4%, a difference of 0.38%), Immigrants from Grenada (1.4%, a difference of 0.47%), Menominee (1.4%, a difference of 0.69%), and Dominican (1.4%, a difference of 0.77%).
| Demographics | Rating | Rank | Doctorate Degree |
| Mexican American Indians | 0.1 /100 | #304 | Tragic 1.4% |
| Pennsylvania Germans | 0.1 /100 | #305 | Tragic 1.4% |
| Guyanese | 0.1 /100 | #306 | Tragic 1.4% |
| Cubans | 0.1 /100 | #307 | Tragic 1.4% |
| Immigrants | Laos | 0.1 /100 | #308 | Tragic 1.4% |
| Immigrants | Grenada | 0.1 /100 | #309 | Tragic 1.4% |
| Immigrants | Jamaica | 0.1 /100 | #310 | Tragic 1.4% |
| Immigrants | Honduras | 0.1 /100 | #311 | Tragic 1.4% |
| Immigrants | Nicaragua | 0.1 /100 | #312 | Tragic 1.4% |
| Menominee | 0.1 /100 | #313 | Tragic 1.4% |
| Dominicans | 0.1 /100 | #314 | Tragic 1.4% |
| Immigrants | Azores | 0.1 /100 | #315 | Tragic 1.4% |
| Navajo | 0.1 /100 | #316 | Tragic 1.4% |
| Immigrants | Micronesia | 0.1 /100 | #317 | Tragic 1.3% |
| Creek | 0.1 /100 | #318 | Tragic 1.3% |