Immigrants from Vietnam vs Subsaharan African No Schooling Completed
COMPARE
Immigrants from Vietnam
Subsaharan African
No Schooling Completed
No Schooling Completed Comparison
Immigrants from Vietnam
Sub-Saharan Africans
3.3%
NO SCHOOLING COMPLETED
0.0/ 100
METRIC RATING
329th/ 347
METRIC RANK
2.3%
NO SCHOOLING COMPLETED
4.7/ 100
METRIC RATING
222nd/ 347
METRIC RANK
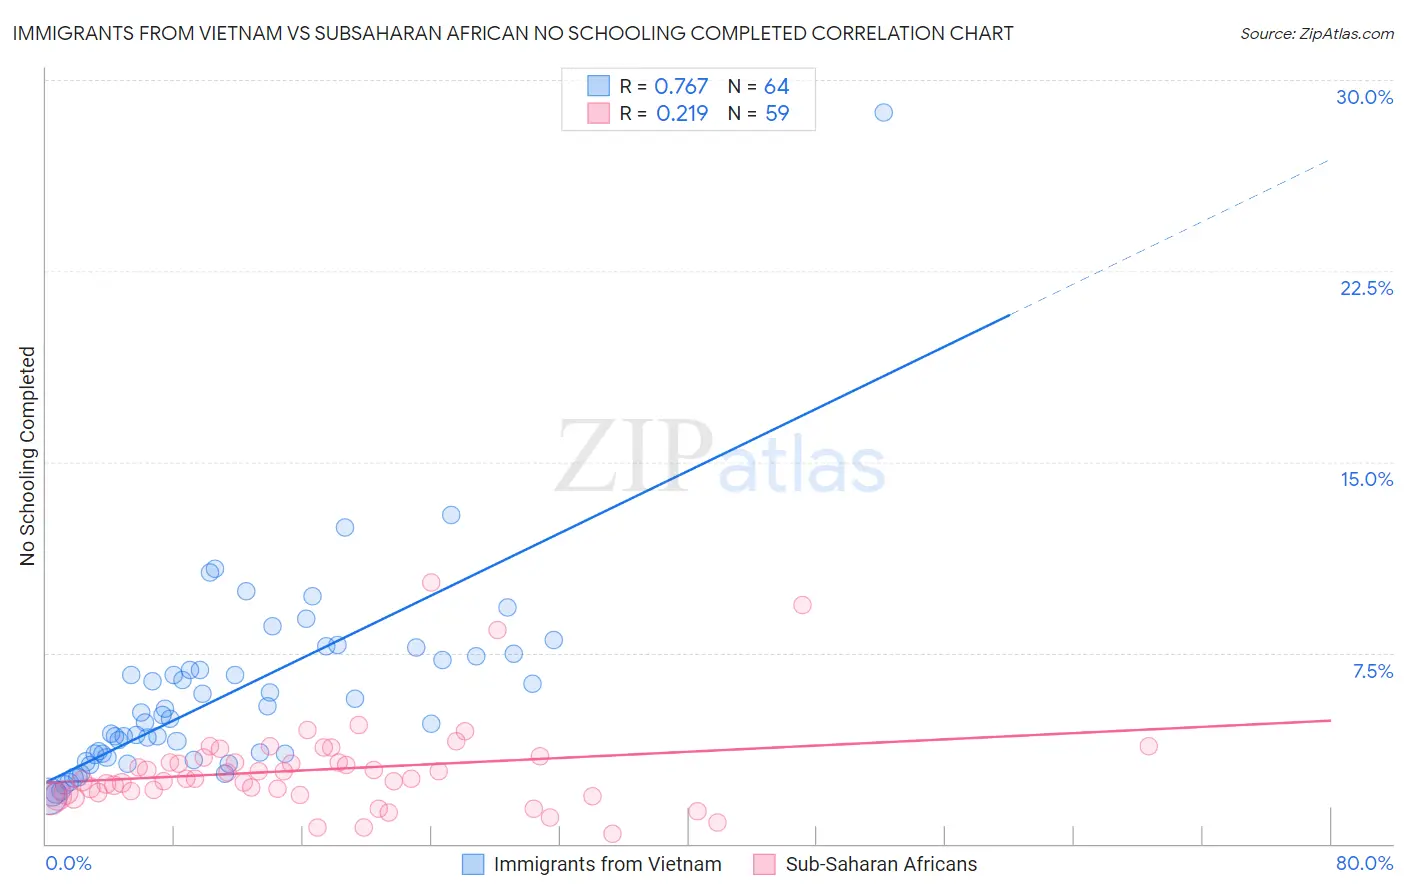
Immigrants from Vietnam vs Subsaharan African No Schooling Completed Correlation Chart
The statistical analysis conducted on geographies consisting of 401,890,779 people shows a strong positive correlation between the proportion of Immigrants from Vietnam and percentage of population with no schooling in the United States with a correlation coefficient (R) of 0.767 and weighted average of 3.3%. Similarly, the statistical analysis conducted on geographies consisting of 500,622,971 people shows a weak positive correlation between the proportion of Sub-Saharan Africans and percentage of population with no schooling in the United States with a correlation coefficient (R) of 0.219 and weighted average of 2.3%, a difference of 44.8%.
No Schooling Completed Correlation Summary
| Measurement | Immigrants from Vietnam | Subsaharan African |
| Minimum | 1.9% | 0.39% |
| Maximum | 28.7% | 10.3% |
| Range | 26.8% | 9.9% |
| Mean | 5.9% | 2.9% |
| Median | 5.0% | 2.5% |
| Interquartile 25% (IQ1) | 3.5% | 2.0% |
| Interquartile 75% (IQ3) | 7.3% | 3.4% |
| Interquartile Range (IQR) | 3.8% | 1.4% |
| Standard Deviation (Sample) | 3.9% | 1.8% |
| Standard Deviation (Population) | 3.9% | 1.8% |
Similar Demographics by No Schooling Completed
Demographics Similar to Immigrants from Vietnam by No Schooling Completed
In terms of no schooling completed, the demographic groups most similar to Immigrants from Vietnam are Immigrants from Armenia (3.3%, a difference of 0.42%), Japanese (3.3%, a difference of 0.45%), Mexican (3.3%, a difference of 1.1%), Immigrants from Latin America (3.3%, a difference of 1.3%), and Central American (3.4%, a difference of 2.0%).
| Demographics | Rating | Rank | No Schooling Completed |
| Immigrants | Honduras | 0.0 /100 | #322 | Tragic 3.2% |
| Vietnamese | 0.0 /100 | #323 | Tragic 3.2% |
| Mexican American Indians | 0.0 /100 | #324 | Tragic 3.2% |
| Dominicans | 0.0 /100 | #325 | Tragic 3.2% |
| Indonesians | 0.0 /100 | #326 | Tragic 3.2% |
| Immigrants | Latin America | 0.0 /100 | #327 | Tragic 3.3% |
| Mexicans | 0.0 /100 | #328 | Tragic 3.3% |
| Immigrants | Vietnam | 0.0 /100 | #329 | Tragic 3.3% |
| Immigrants | Armenia | 0.0 /100 | #330 | Tragic 3.3% |
| Japanese | 0.0 /100 | #331 | Tragic 3.3% |
| Central Americans | 0.0 /100 | #332 | Tragic 3.4% |
| Immigrants | Dominican Republic | 0.0 /100 | #333 | Tragic 3.4% |
| Guatemalans | 0.0 /100 | #334 | Tragic 3.5% |
| Immigrants | Cambodia | 0.0 /100 | #335 | Tragic 3.5% |
| Immigrants | Fiji | 0.0 /100 | #336 | Tragic 3.5% |
Demographics Similar to Sub-Saharan Africans by No Schooling Completed
In terms of no schooling completed, the demographic groups most similar to Sub-Saharan Africans are Immigrants from Lebanon (2.3%, a difference of 0.15%), Immigrants from Sudan (2.3%, a difference of 0.17%), Immigrants from Costa Rica (2.3%, a difference of 0.26%), Tohono O'odham (2.3%, a difference of 0.44%), and Sudanese (2.3%, a difference of 0.44%).
| Demographics | Rating | Rank | No Schooling Completed |
| Immigrants | Zaire | 7.2 /100 | #215 | Tragic 2.3% |
| Tongans | 6.8 /100 | #216 | Tragic 2.3% |
| Immigrants | Syria | 6.6 /100 | #217 | Tragic 2.3% |
| Immigrants | Nepal | 6.4 /100 | #218 | Tragic 2.3% |
| Senegalese | 5.6 /100 | #219 | Tragic 2.3% |
| Immigrants | Costa Rica | 5.1 /100 | #220 | Tragic 2.3% |
| Immigrants | Sudan | 5.0 /100 | #221 | Tragic 2.3% |
| Sub-Saharan Africans | 4.7 /100 | #222 | Tragic 2.3% |
| Immigrants | Lebanon | 4.5 /100 | #223 | Tragic 2.3% |
| Tohono O'odham | 4.1 /100 | #224 | Tragic 2.3% |
| Sudanese | 4.1 /100 | #225 | Tragic 2.3% |
| Sierra Leoneans | 4.1 /100 | #226 | Tragic 2.3% |
| Immigrants | Uganda | 4.0 /100 | #227 | Tragic 2.3% |
| U.S. Virgin Islanders | 3.7 /100 | #228 | Tragic 2.3% |
| Immigrants | Pakistan | 3.6 /100 | #229 | Tragic 2.3% |