Hawaiian vs Subsaharan African No Schooling Completed
COMPARE
Hawaiian
Subsaharan African
No Schooling Completed
No Schooling Completed Comparison
Hawaiians
Sub-Saharan Africans
2.2%
NO SCHOOLING COMPLETED
27.0/ 100
METRIC RATING
195th/ 347
METRIC RANK
2.3%
NO SCHOOLING COMPLETED
4.7/ 100
METRIC RATING
222nd/ 347
METRIC RANK
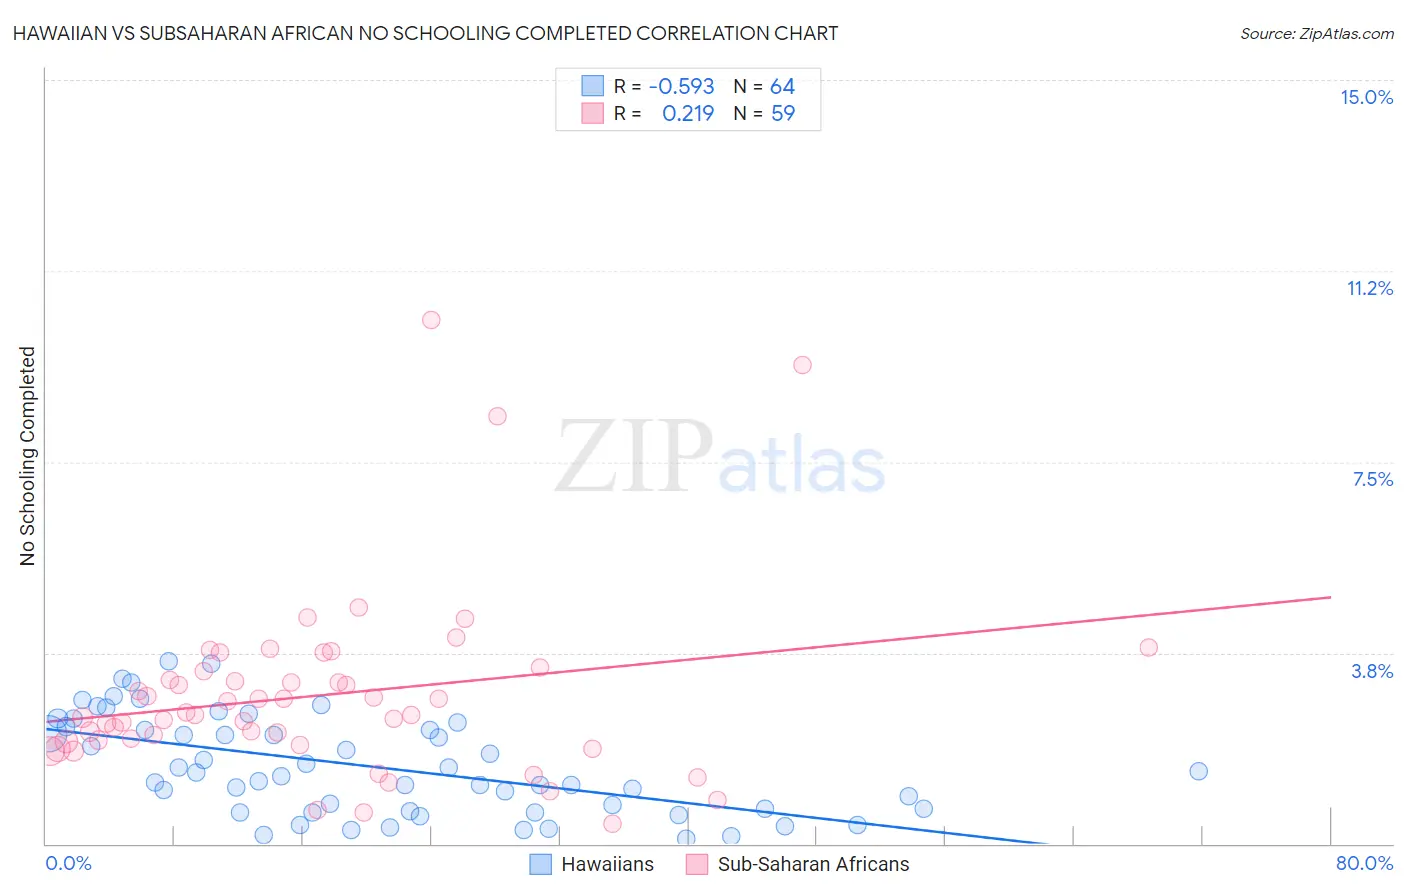
Hawaiian vs Subsaharan African No Schooling Completed Correlation Chart
The statistical analysis conducted on geographies consisting of 324,490,486 people shows a substantial negative correlation between the proportion of Hawaiians and percentage of population with no schooling in the United States with a correlation coefficient (R) of -0.593 and weighted average of 2.2%. Similarly, the statistical analysis conducted on geographies consisting of 500,622,971 people shows a weak positive correlation between the proportion of Sub-Saharan Africans and percentage of population with no schooling in the United States with a correlation coefficient (R) of 0.219 and weighted average of 2.3%, a difference of 6.5%.
No Schooling Completed Correlation Summary
| Measurement | Hawaiian | Subsaharan African |
| Minimum | 0.093% | 0.39% |
| Maximum | 3.6% | 10.3% |
| Range | 3.5% | 9.9% |
| Mean | 1.5% | 2.9% |
| Median | 1.4% | 2.5% |
| Interquartile 25% (IQ1) | 0.66% | 2.0% |
| Interquartile 75% (IQ3) | 2.3% | 3.4% |
| Interquartile Range (IQR) | 1.6% | 1.4% |
| Standard Deviation (Sample) | 0.96% | 1.8% |
| Standard Deviation (Population) | 0.95% | 1.8% |
Similar Demographics by No Schooling Completed
Demographics Similar to Hawaiians by No Schooling Completed
In terms of no schooling completed, the demographic groups most similar to Hawaiians are Immigrants from Ukraine (2.2%, a difference of 0.15%), Immigrants from Albania (2.2%, a difference of 0.20%), Paraguayan (2.2%, a difference of 0.37%), Guamanian/Chamorro (2.2%, a difference of 0.44%), and Immigrants from Southern Europe (2.2%, a difference of 0.56%).
| Demographics | Rating | Rank | No Schooling Completed |
| Immigrants | Kenya | 36.2 /100 | #188 | Fair 2.1% |
| Immigrants | Egypt | 36.1 /100 | #189 | Fair 2.1% |
| Spanish Americans | 32.6 /100 | #190 | Fair 2.1% |
| Bermudans | 30.7 /100 | #191 | Fair 2.1% |
| Guamanians/Chamorros | 29.8 /100 | #192 | Fair 2.2% |
| Paraguayans | 29.3 /100 | #193 | Fair 2.2% |
| Immigrants | Albania | 28.3 /100 | #194 | Fair 2.2% |
| Hawaiians | 27.0 /100 | #195 | Fair 2.2% |
| Immigrants | Ukraine | 26.1 /100 | #196 | Fair 2.2% |
| Immigrants | Southern Europe | 23.8 /100 | #197 | Fair 2.2% |
| Immigrants | Chile | 22.7 /100 | #198 | Fair 2.2% |
| Africans | 21.8 /100 | #199 | Fair 2.2% |
| Immigrants | Northern Africa | 19.5 /100 | #200 | Poor 2.2% |
| Costa Ricans | 17.1 /100 | #201 | Poor 2.2% |
| Moroccans | 13.7 /100 | #202 | Poor 2.2% |
Demographics Similar to Sub-Saharan Africans by No Schooling Completed
In terms of no schooling completed, the demographic groups most similar to Sub-Saharan Africans are Immigrants from Lebanon (2.3%, a difference of 0.15%), Immigrants from Sudan (2.3%, a difference of 0.17%), Immigrants from Costa Rica (2.3%, a difference of 0.26%), Tohono O'odham (2.3%, a difference of 0.44%), and Sudanese (2.3%, a difference of 0.44%).
| Demographics | Rating | Rank | No Schooling Completed |
| Immigrants | Zaire | 7.2 /100 | #215 | Tragic 2.3% |
| Tongans | 6.8 /100 | #216 | Tragic 2.3% |
| Immigrants | Syria | 6.6 /100 | #217 | Tragic 2.3% |
| Immigrants | Nepal | 6.4 /100 | #218 | Tragic 2.3% |
| Senegalese | 5.6 /100 | #219 | Tragic 2.3% |
| Immigrants | Costa Rica | 5.1 /100 | #220 | Tragic 2.3% |
| Immigrants | Sudan | 5.0 /100 | #221 | Tragic 2.3% |
| Sub-Saharan Africans | 4.7 /100 | #222 | Tragic 2.3% |
| Immigrants | Lebanon | 4.5 /100 | #223 | Tragic 2.3% |
| Tohono O'odham | 4.1 /100 | #224 | Tragic 2.3% |
| Sudanese | 4.1 /100 | #225 | Tragic 2.3% |
| Sierra Leoneans | 4.1 /100 | #226 | Tragic 2.3% |
| Immigrants | Uganda | 4.0 /100 | #227 | Tragic 2.3% |
| U.S. Virgin Islanders | 3.7 /100 | #228 | Tragic 2.3% |
| Immigrants | Pakistan | 3.6 /100 | #229 | Tragic 2.3% |