Immigrants from Indonesia vs Subsaharan African No Schooling Completed
COMPARE
Immigrants from Indonesia
Subsaharan African
No Schooling Completed
No Schooling Completed Comparison
Immigrants from Indonesia
Sub-Saharan Africans
2.4%
NO SCHOOLING COMPLETED
1.5/ 100
METRIC RATING
242nd/ 347
METRIC RANK
2.3%
NO SCHOOLING COMPLETED
4.7/ 100
METRIC RATING
222nd/ 347
METRIC RANK
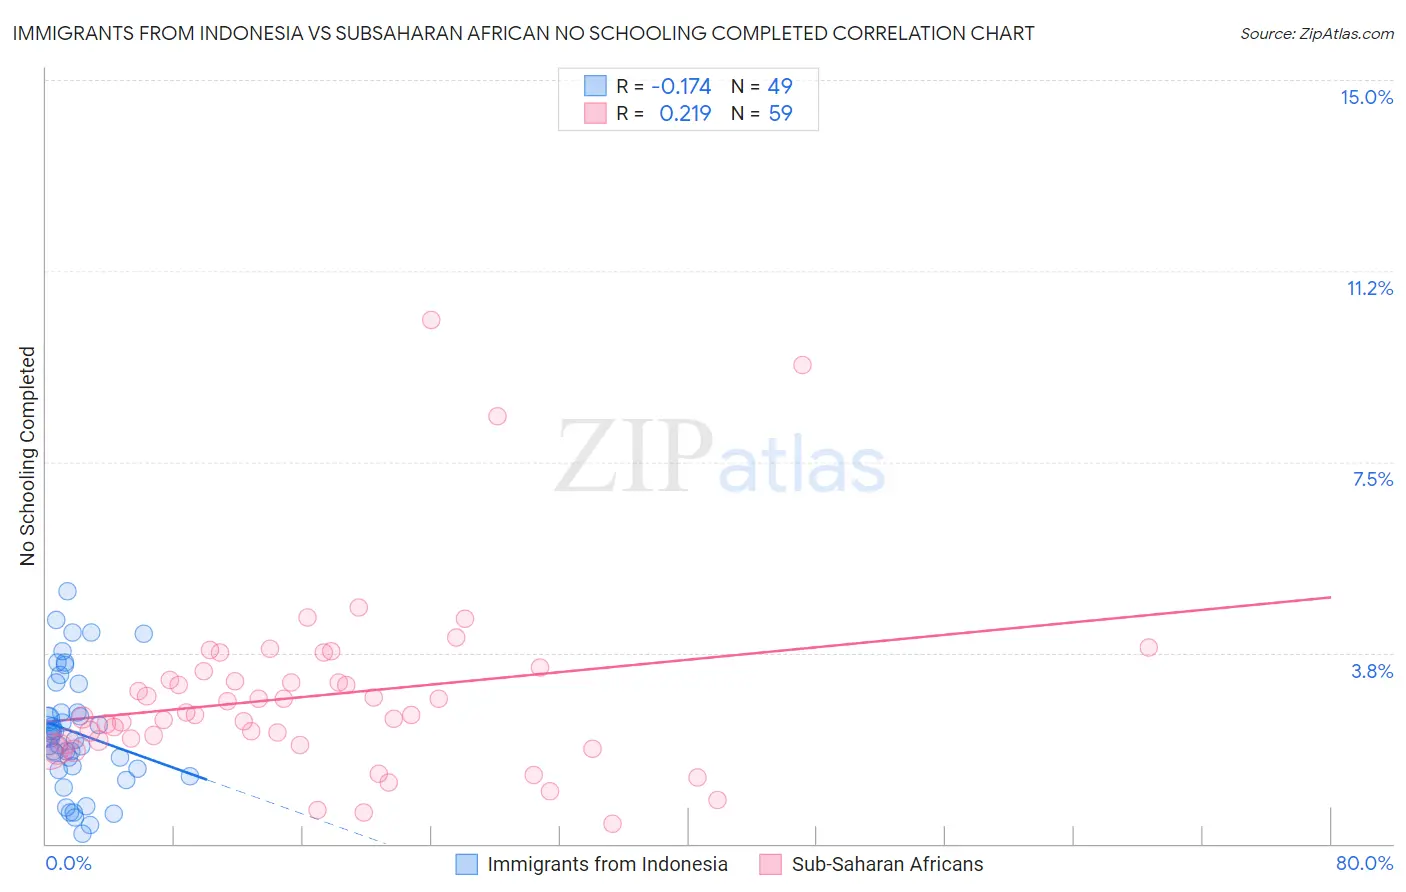
Immigrants from Indonesia vs Subsaharan African No Schooling Completed Correlation Chart
The statistical analysis conducted on geographies consisting of 214,703,374 people shows a poor negative correlation between the proportion of Immigrants from Indonesia and percentage of population with no schooling in the United States with a correlation coefficient (R) of -0.174 and weighted average of 2.4%. Similarly, the statistical analysis conducted on geographies consisting of 500,622,971 people shows a weak positive correlation between the proportion of Sub-Saharan Africans and percentage of population with no schooling in the United States with a correlation coefficient (R) of 0.219 and weighted average of 2.3%, a difference of 3.6%.
No Schooling Completed Correlation Summary
| Measurement | Immigrants from Indonesia | Subsaharan African |
| Minimum | 0.18% | 0.39% |
| Maximum | 4.9% | 10.3% |
| Range | 4.8% | 9.9% |
| Mean | 2.2% | 2.9% |
| Median | 2.1% | 2.5% |
| Interquartile 25% (IQ1) | 1.5% | 2.0% |
| Interquartile 75% (IQ3) | 2.9% | 3.4% |
| Interquartile Range (IQR) | 1.4% | 1.4% |
| Standard Deviation (Sample) | 1.1% | 1.8% |
| Standard Deviation (Population) | 1.1% | 1.8% |
Demographics Similar to Immigrants from Indonesia and Sub-Saharan Africans by No Schooling Completed
In terms of no schooling completed, the demographic groups most similar to Immigrants from Indonesia are Korean (2.4%, a difference of 0.32%), Immigrants from Senegal (2.4%, a difference of 0.38%), Liberian (2.4%, a difference of 0.61%), Paiute (2.4%, a difference of 0.73%), and Immigrants from Eastern Asia (2.4%, a difference of 0.95%). Similarly, the demographic groups most similar to Sub-Saharan Africans are Immigrants from Lebanon (2.3%, a difference of 0.15%), Tohono O'odham (2.3%, a difference of 0.44%), Sudanese (2.3%, a difference of 0.44%), Sierra Leonean (2.3%, a difference of 0.46%), and Immigrants from Uganda (2.3%, a difference of 0.51%).
| Demographics | Rating | Rank | No Schooling Completed |
| Sub-Saharan Africans | 4.7 /100 | #222 | Tragic 2.3% |
| Immigrants | Lebanon | 4.5 /100 | #223 | Tragic 2.3% |
| Tohono O'odham | 4.1 /100 | #224 | Tragic 2.3% |
| Sudanese | 4.1 /100 | #225 | Tragic 2.3% |
| Sierra Leoneans | 4.1 /100 | #226 | Tragic 2.3% |
| Immigrants | Uganda | 4.0 /100 | #227 | Tragic 2.3% |
| U.S. Virgin Islanders | 3.7 /100 | #228 | Tragic 2.3% |
| Immigrants | Pakistan | 3.6 /100 | #229 | Tragic 2.3% |
| Puerto Ricans | 3.4 /100 | #230 | Tragic 2.3% |
| Immigrants | Uruguay | 3.4 /100 | #231 | Tragic 2.3% |
| Colombians | 3.2 /100 | #232 | Tragic 2.3% |
| Immigrants | Malaysia | 2.8 /100 | #233 | Tragic 2.3% |
| Nigerians | 2.6 /100 | #234 | Tragic 2.3% |
| Immigrants | Western Asia | 2.6 /100 | #235 | Tragic 2.3% |
| Iraqis | 2.2 /100 | #236 | Tragic 2.4% |
| Immigrants | Eastern Asia | 2.0 /100 | #237 | Tragic 2.4% |
| Paiute | 1.9 /100 | #238 | Tragic 2.4% |
| Liberians | 1.8 /100 | #239 | Tragic 2.4% |
| Immigrants | Senegal | 1.7 /100 | #240 | Tragic 2.4% |
| Koreans | 1.7 /100 | #241 | Tragic 2.4% |
| Immigrants | Indonesia | 1.5 /100 | #242 | Tragic 2.4% |