Thai vs Turkish No Schooling Completed
COMPARE
Thai
Turkish
No Schooling Completed
No Schooling Completed Comparison
Thais
Turks
1.8%
NO SCHOOLING COMPLETED
97.5/ 100
METRIC RATING
104th/ 347
METRIC RANK
1.8%
NO SCHOOLING COMPLETED
98.7/ 100
METRIC RATING
93rd/ 347
METRIC RANK
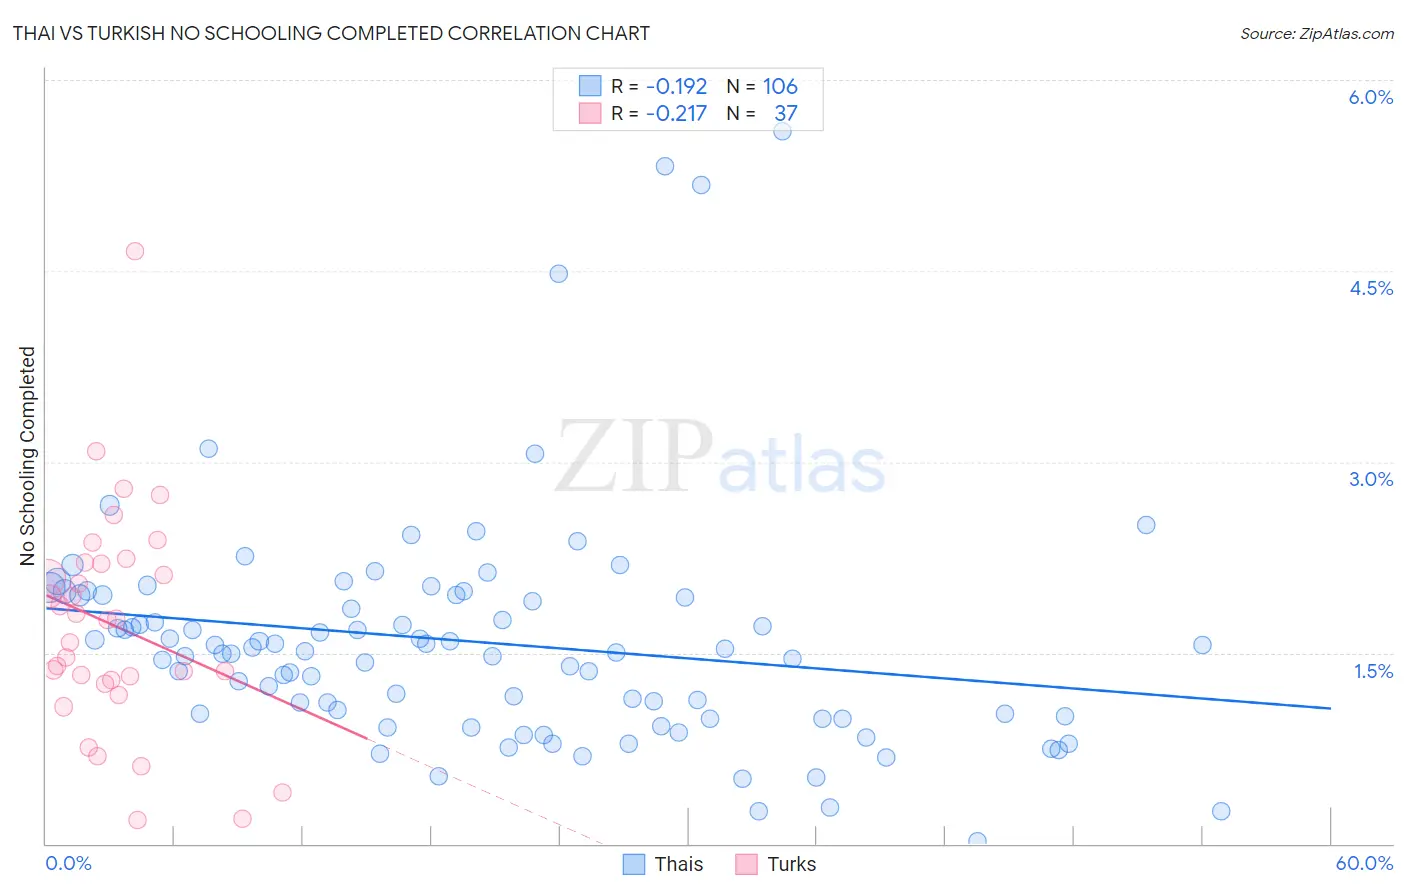
Thai vs Turkish No Schooling Completed Correlation Chart
The statistical analysis conducted on geographies consisting of 469,412,663 people shows a poor negative correlation between the proportion of Thais and percentage of population with no schooling in the United States with a correlation coefficient (R) of -0.192 and weighted average of 1.8%. Similarly, the statistical analysis conducted on geographies consisting of 270,038,657 people shows a weak negative correlation between the proportion of Turks and percentage of population with no schooling in the United States with a correlation coefficient (R) of -0.217 and weighted average of 1.8%, a difference of 2.5%.
No Schooling Completed Correlation Summary
| Measurement | Thai | Turkish |
| Minimum | 0.015% | 0.19% |
| Maximum | 5.6% | 4.7% |
| Range | 5.6% | 4.5% |
| Mean | 1.6% | 1.7% |
| Median | 1.5% | 1.8% |
| Interquartile 25% (IQ1) | 1.0% | 1.3% |
| Interquartile 75% (IQ3) | 2.0% | 2.2% |
| Interquartile Range (IQR) | 0.95% | 0.94% |
| Standard Deviation (Sample) | 0.92% | 0.87% |
| Standard Deviation (Population) | 0.92% | 0.86% |
Demographics Similar to Thais and Turks by No Schooling Completed
In terms of no schooling completed, the demographic groups most similar to Thais are German Russian (1.8%, a difference of 0.020%), Immigrants from France (1.8%, a difference of 0.42%), Yugoslavian (1.8%, a difference of 0.46%), Basque (1.8%, a difference of 0.57%), and Immigrants from Czechoslovakia (1.8%, a difference of 0.63%). Similarly, the demographic groups most similar to Turks are Romanian (1.8%, a difference of 0.37%), Nonimmigrants (1.8%, a difference of 0.50%), Puget Sound Salish (1.8%, a difference of 0.51%), Bhutanese (1.8%, a difference of 0.74%), and Immigrants from Germany (1.8%, a difference of 0.89%).
| Demographics | Rating | Rank | No Schooling Completed |
| Immigrants | Western Europe | 99.2 /100 | #88 | Exceptional 1.8% |
| South Africans | 99.1 /100 | #89 | Exceptional 1.8% |
| Sioux | 99.0 /100 | #90 | Exceptional 1.8% |
| Immigrants | Germany | 99.0 /100 | #91 | Exceptional 1.8% |
| Romanians | 98.8 /100 | #92 | Exceptional 1.8% |
| Turks | 98.7 /100 | #93 | Exceptional 1.8% |
| Immigrants | Nonimmigrants | 98.5 /100 | #94 | Exceptional 1.8% |
| Puget Sound Salish | 98.5 /100 | #95 | Exceptional 1.8% |
| Bhutanese | 98.4 /100 | #96 | Exceptional 1.8% |
| Immigrants | Ireland | 98.4 /100 | #97 | Exceptional 1.8% |
| Iranians | 98.2 /100 | #98 | Exceptional 1.8% |
| Choctaw | 98.1 /100 | #99 | Exceptional 1.8% |
| Immigrants | Singapore | 98.0 /100 | #100 | Exceptional 1.8% |
| Immigrants | Czechoslovakia | 97.9 /100 | #101 | Exceptional 1.8% |
| Immigrants | Switzerland | 97.9 /100 | #102 | Exceptional 1.8% |
| Basques | 97.9 /100 | #103 | Exceptional 1.8% |
| Thais | 97.5 /100 | #104 | Exceptional 1.8% |
| German Russians | 97.5 /100 | #105 | Exceptional 1.8% |
| Immigrants | France | 97.3 /100 | #106 | Exceptional 1.8% |
| Yugoslavians | 97.2 /100 | #107 | Exceptional 1.8% |
| Okinawans | 97.1 /100 | #108 | Exceptional 1.8% |