Thai vs Cuban 10th Grade
COMPARE
Thai
Cuban
10th Grade
10th Grade Comparison
Thais
Cubans
95.0%
10TH GRADE
99.8/ 100
METRIC RATING
62nd/ 347
METRIC RANK
91.5%
10TH GRADE
0.0/ 100
METRIC RATING
298th/ 347
METRIC RANK
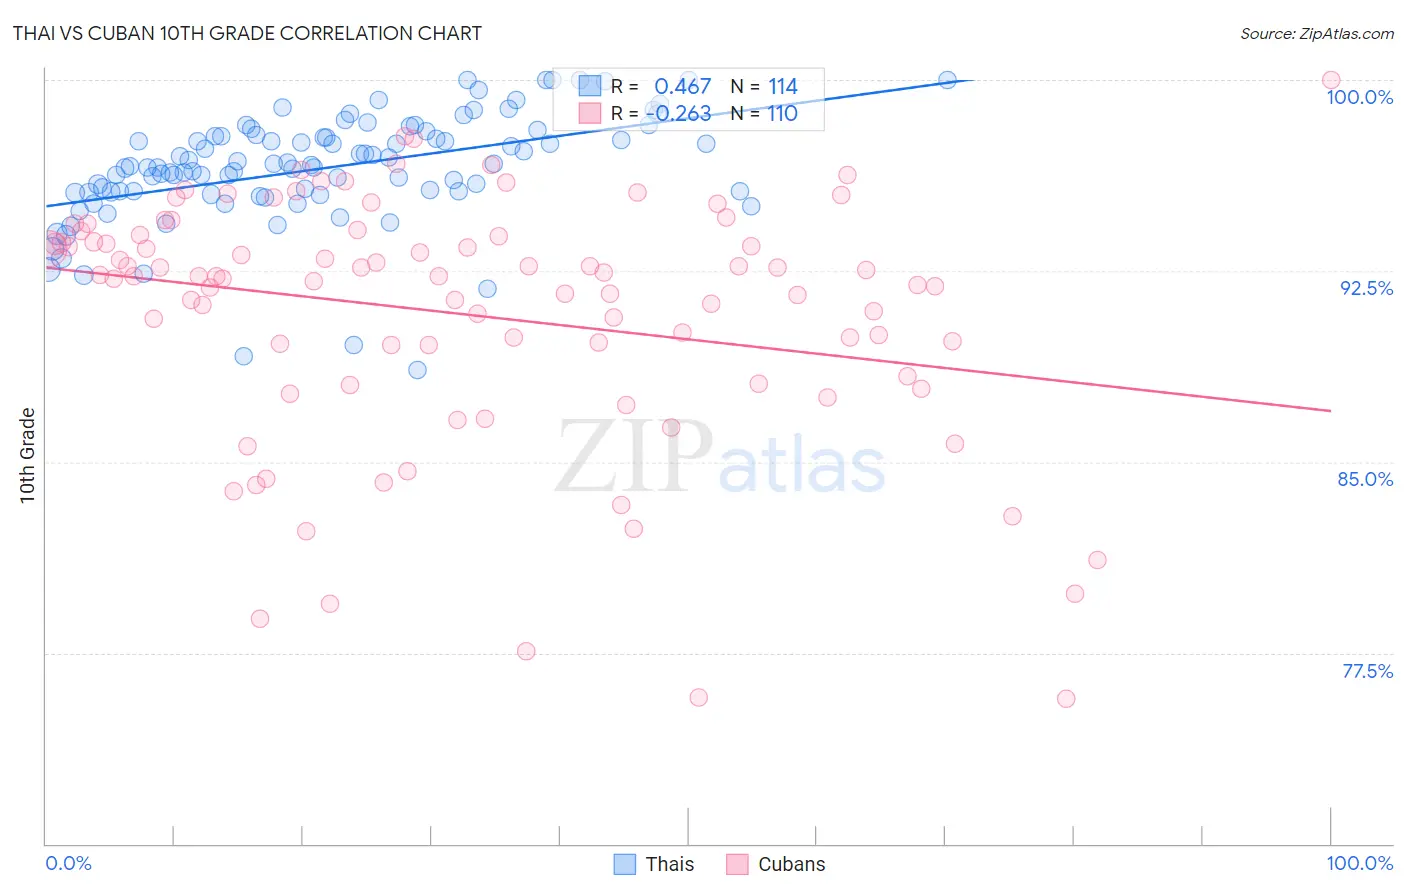
Thai vs Cuban 10th Grade Correlation Chart
The statistical analysis conducted on geographies consisting of 475,814,962 people shows a moderate positive correlation between the proportion of Thais and percentage of population with at least 10th grade education in the United States with a correlation coefficient (R) of 0.467 and weighted average of 95.0%. Similarly, the statistical analysis conducted on geographies consisting of 449,373,052 people shows a weak negative correlation between the proportion of Cubans and percentage of population with at least 10th grade education in the United States with a correlation coefficient (R) of -0.263 and weighted average of 91.5%, a difference of 3.8%.
10th Grade Correlation Summary
| Measurement | Thai | Cuban |
| Minimum | 88.6% | 75.7% |
| Maximum | 100.0% | 100.0% |
| Range | 11.4% | 24.3% |
| Mean | 96.5% | 90.8% |
| Median | 96.6% | 92.3% |
| Interquartile 25% (IQ1) | 95.6% | 88.3% |
| Interquartile 75% (IQ3) | 97.8% | 93.9% |
| Interquartile Range (IQR) | 2.2% | 5.5% |
| Standard Deviation (Sample) | 2.2% | 4.9% |
| Standard Deviation (Population) | 2.1% | 4.9% |
Similar Demographics by 10th Grade
Demographics Similar to Thais by 10th Grade
In terms of 10th grade, the demographic groups most similar to Thais are Immigrants from Singapore (95.0%, a difference of 0.0%), Cypriot (95.0%, a difference of 0.010%), Chippewa (95.0%, a difference of 0.010%), Native Hawaiian (95.0%, a difference of 0.010%), and Ukrainian (95.0%, a difference of 0.020%).
| Demographics | Rating | Rank | 10th Grade |
| Immigrants | Ireland | 99.8 /100 | #55 | Exceptional 95.0% |
| New Zealanders | 99.8 /100 | #56 | Exceptional 95.0% |
| Ukrainians | 99.8 /100 | #57 | Exceptional 95.0% |
| Aleuts | 99.8 /100 | #58 | Exceptional 95.0% |
| Celtics | 99.8 /100 | #59 | Exceptional 95.0% |
| Cypriots | 99.8 /100 | #60 | Exceptional 95.0% |
| Chippewa | 99.8 /100 | #61 | Exceptional 95.0% |
| Thais | 99.8 /100 | #62 | Exceptional 95.0% |
| Immigrants | Singapore | 99.8 /100 | #63 | Exceptional 95.0% |
| Native Hawaiians | 99.7 /100 | #64 | Exceptional 95.0% |
| Turks | 99.7 /100 | #65 | Exceptional 95.0% |
| Immigrants | Australia | 99.7 /100 | #66 | Exceptional 94.9% |
| Immigrants | Netherlands | 99.7 /100 | #67 | Exceptional 94.9% |
| Immigrants | Belgium | 99.7 /100 | #68 | Exceptional 94.9% |
| Immigrants | England | 99.6 /100 | #69 | Exceptional 94.9% |
Demographics Similar to Cubans by 10th Grade
In terms of 10th grade, the demographic groups most similar to Cubans are Fijian (91.5%, a difference of 0.020%), Immigrants from Haiti (91.4%, a difference of 0.080%), Guyanese (91.4%, a difference of 0.12%), Immigrants from Grenada (91.6%, a difference of 0.17%), and Japanese (91.2%, a difference of 0.27%).
| Demographics | Rating | Rank | 10th Grade |
| Immigrants | West Indies | 0.0 /100 | #291 | Tragic 91.8% |
| Immigrants | Burma/Myanmar | 0.0 /100 | #292 | Tragic 91.8% |
| Indonesians | 0.0 /100 | #293 | Tragic 91.8% |
| Haitians | 0.0 /100 | #294 | Tragic 91.8% |
| Lumbee | 0.0 /100 | #295 | Tragic 91.7% |
| Immigrants | Grenada | 0.0 /100 | #296 | Tragic 91.6% |
| Fijians | 0.0 /100 | #297 | Tragic 91.5% |
| Cubans | 0.0 /100 | #298 | Tragic 91.5% |
| Immigrants | Haiti | 0.0 /100 | #299 | Tragic 91.4% |
| Guyanese | 0.0 /100 | #300 | Tragic 91.4% |
| Japanese | 0.0 /100 | #301 | Tragic 91.2% |
| Immigrants | Guyana | 0.0 /100 | #302 | Tragic 91.2% |
| Immigrants | Vietnam | 0.0 /100 | #303 | Tragic 91.2% |
| Pima | 0.0 /100 | #304 | Tragic 91.2% |
| Immigrants | Dominica | 0.0 /100 | #305 | Tragic 91.1% |