Thai vs Alsatian 10th Grade
COMPARE
Thai
Alsatian
10th Grade
10th Grade Comparison
Thais
Alsatians
95.0%
10TH GRADE
99.8/ 100
METRIC RATING
62nd/ 347
METRIC RANK
93.8%
10TH GRADE
59.4/ 100
METRIC RATING
168th/ 347
METRIC RANK
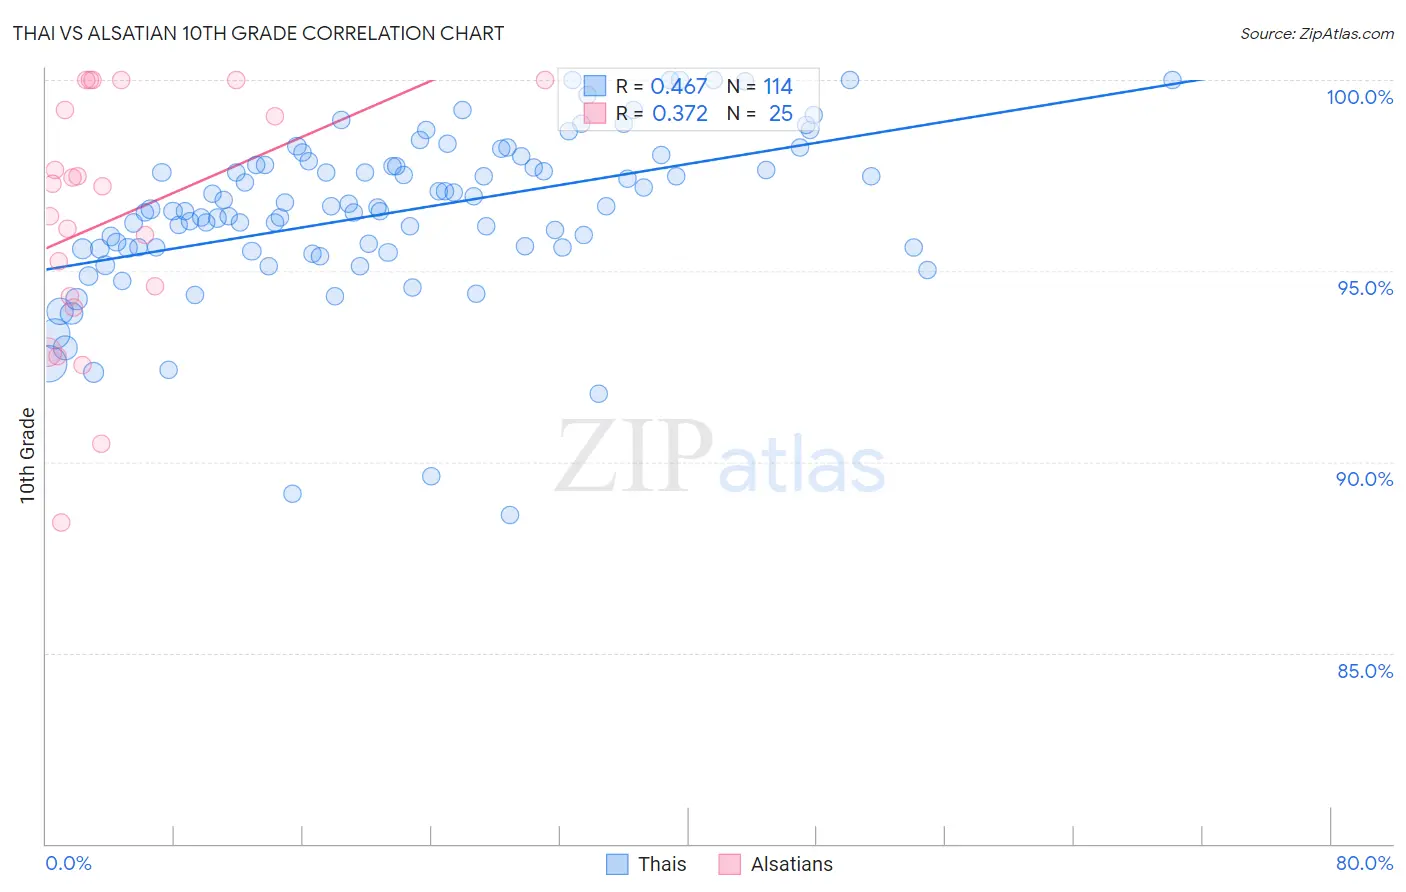
Thai vs Alsatian 10th Grade Correlation Chart
The statistical analysis conducted on geographies consisting of 475,814,962 people shows a moderate positive correlation between the proportion of Thais and percentage of population with at least 10th grade education in the United States with a correlation coefficient (R) of 0.467 and weighted average of 95.0%. Similarly, the statistical analysis conducted on geographies consisting of 82,682,365 people shows a mild positive correlation between the proportion of Alsatians and percentage of population with at least 10th grade education in the United States with a correlation coefficient (R) of 0.372 and weighted average of 93.8%, a difference of 1.3%.
10th Grade Correlation Summary
| Measurement | Thai | Alsatian |
| Minimum | 88.6% | 88.4% |
| Maximum | 100.0% | 100.0% |
| Range | 11.4% | 11.6% |
| Mean | 96.5% | 96.4% |
| Median | 96.6% | 97.2% |
| Interquartile 25% (IQ1) | 95.6% | 94.2% |
| Interquartile 75% (IQ3) | 97.8% | 99.6% |
| Interquartile Range (IQR) | 2.2% | 5.4% |
| Standard Deviation (Sample) | 2.2% | 3.2% |
| Standard Deviation (Population) | 2.1% | 3.2% |
Similar Demographics by 10th Grade
Demographics Similar to Thais by 10th Grade
In terms of 10th grade, the demographic groups most similar to Thais are Immigrants from Singapore (95.0%, a difference of 0.0%), Cypriot (95.0%, a difference of 0.010%), Chippewa (95.0%, a difference of 0.010%), Native Hawaiian (95.0%, a difference of 0.010%), and Ukrainian (95.0%, a difference of 0.020%).
| Demographics | Rating | Rank | 10th Grade |
| Immigrants | Ireland | 99.8 /100 | #55 | Exceptional 95.0% |
| New Zealanders | 99.8 /100 | #56 | Exceptional 95.0% |
| Ukrainians | 99.8 /100 | #57 | Exceptional 95.0% |
| Aleuts | 99.8 /100 | #58 | Exceptional 95.0% |
| Celtics | 99.8 /100 | #59 | Exceptional 95.0% |
| Cypriots | 99.8 /100 | #60 | Exceptional 95.0% |
| Chippewa | 99.8 /100 | #61 | Exceptional 95.0% |
| Thais | 99.8 /100 | #62 | Exceptional 95.0% |
| Immigrants | Singapore | 99.8 /100 | #63 | Exceptional 95.0% |
| Native Hawaiians | 99.7 /100 | #64 | Exceptional 95.0% |
| Turks | 99.7 /100 | #65 | Exceptional 95.0% |
| Immigrants | Australia | 99.7 /100 | #66 | Exceptional 94.9% |
| Immigrants | Netherlands | 99.7 /100 | #67 | Exceptional 94.9% |
| Immigrants | Belgium | 99.7 /100 | #68 | Exceptional 94.9% |
| Immigrants | England | 99.6 /100 | #69 | Exceptional 94.9% |
Demographics Similar to Alsatians by 10th Grade
In terms of 10th grade, the demographic groups most similar to Alsatians are Immigrants from Iraq (93.8%, a difference of 0.030%), Immigrants from Egypt (93.8%, a difference of 0.030%), Immigrants from Spain (93.8%, a difference of 0.030%), Brazilian (93.8%, a difference of 0.040%), and Immigrants from Venezuela (93.8%, a difference of 0.050%).
| Demographics | Rating | Rank | 10th Grade |
| Assyrians/Chaldeans/Syriacs | 69.7 /100 | #161 | Good 93.9% |
| Immigrants | Poland | 69.6 /100 | #162 | Good 93.9% |
| Venezuelans | 69.5 /100 | #163 | Good 93.9% |
| Iraqis | 68.1 /100 | #164 | Good 93.9% |
| Brazilians | 63.6 /100 | #165 | Good 93.8% |
| Immigrants | Iraq | 63.0 /100 | #166 | Good 93.8% |
| Immigrants | Egypt | 62.3 /100 | #167 | Good 93.8% |
| Alsatians | 59.4 /100 | #168 | Average 93.8% |
| Immigrants | Spain | 55.9 /100 | #169 | Average 93.8% |
| Immigrants | Venezuela | 53.9 /100 | #170 | Average 93.8% |
| Immigrants | Albania | 52.4 /100 | #171 | Average 93.8% |
| French American Indians | 50.9 /100 | #172 | Average 93.7% |
| Spaniards | 50.3 /100 | #173 | Average 93.7% |
| Argentineans | 50.0 /100 | #174 | Average 93.7% |
| Immigrants | Nepal | 49.6 /100 | #175 | Average 93.7% |