Thai vs Cuban Unemployment Among Ages 20 to 24 years
COMPARE
Thai
Cuban
Unemployment Among Ages 20 to 24 years
Unemployment Among Ages 20 to 24 years Comparison
Thais
Cubans
10.0%
UNEMPLOYMENT AMONG AGES 20 TO 24 YEARS
96.2/ 100
METRIC RATING
96th/ 347
METRIC RANK
9.2%
UNEMPLOYMENT AMONG AGES 20 TO 24 YEARS
100.0/ 100
METRIC RATING
12th/ 347
METRIC RANK
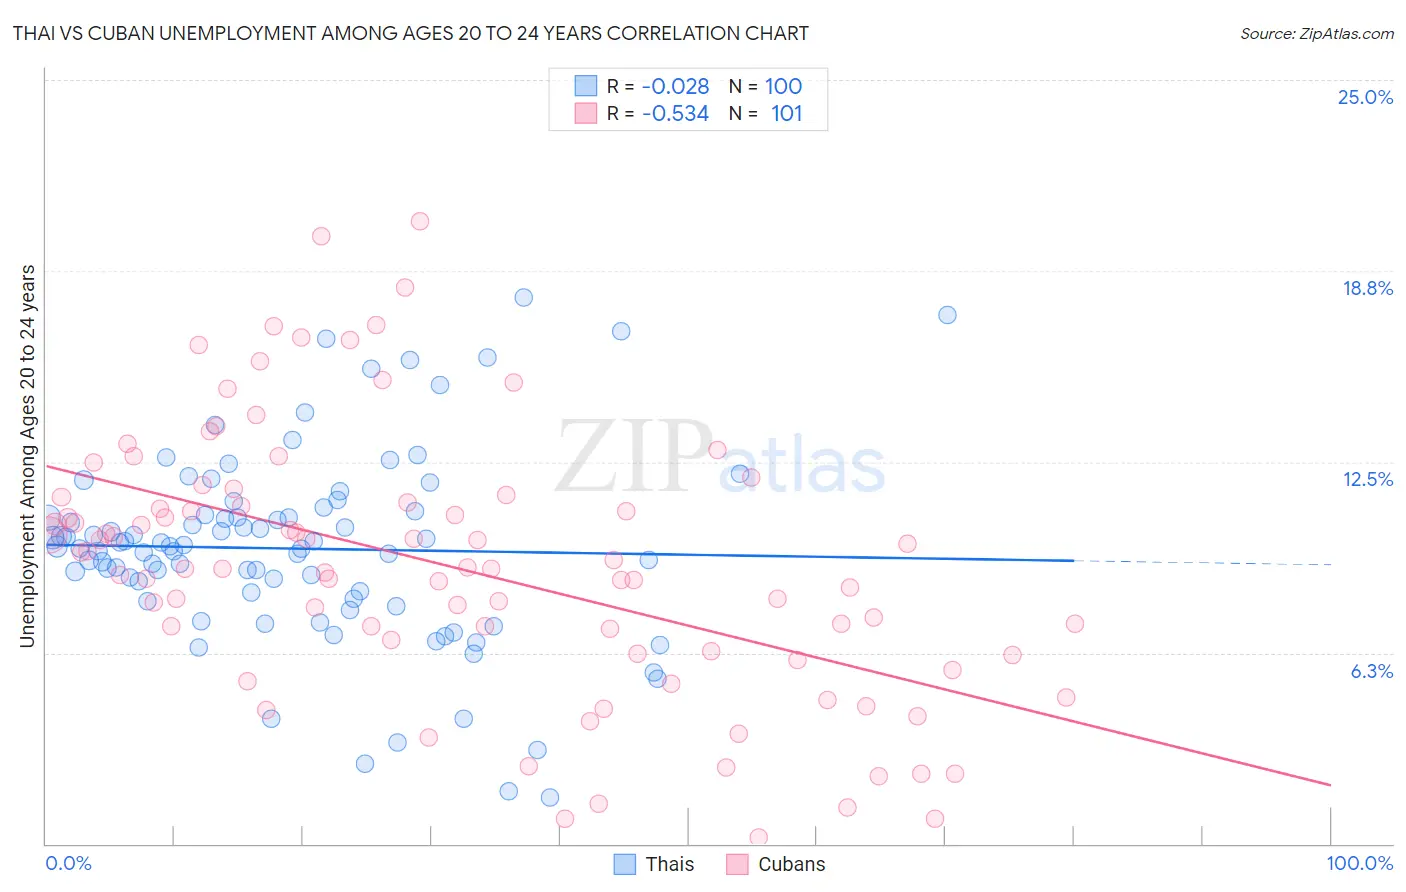
Thai vs Cuban Unemployment Among Ages 20 to 24 years Correlation Chart
The statistical analysis conducted on geographies consisting of 457,745,376 people shows no correlation between the proportion of Thais and unemployment rate among population between the ages 20 and 24 in the United States with a correlation coefficient (R) of -0.028 and weighted average of 10.0%. Similarly, the statistical analysis conducted on geographies consisting of 433,228,061 people shows a substantial negative correlation between the proportion of Cubans and unemployment rate among population between the ages 20 and 24 in the United States with a correlation coefficient (R) of -0.534 and weighted average of 9.2%, a difference of 8.5%.
Unemployment Among Ages 20 to 24 years Correlation Summary
| Measurement | Thai | Cuban |
| Minimum | 1.5% | 0.20% |
| Maximum | 17.9% | 20.4% |
| Range | 16.4% | 20.2% |
| Mean | 9.7% | 9.1% |
| Median | 9.7% | 9.0% |
| Interquartile 25% (IQ1) | 8.1% | 6.2% |
| Interquartile 75% (IQ3) | 10.8% | 11.3% |
| Interquartile Range (IQR) | 2.7% | 5.0% |
| Standard Deviation (Sample) | 3.1% | 4.3% |
| Standard Deviation (Population) | 3.1% | 4.3% |
Similar Demographics by Unemployment Among Ages 20 to 24 years
Demographics Similar to Thais by Unemployment Among Ages 20 to 24 years
In terms of unemployment among ages 20 to 24 years, the demographic groups most similar to Thais are Scotch-Irish (10.0%, a difference of 0.0%), Slavic (10.0%, a difference of 0.040%), Immigrants from Micronesia (10.0%, a difference of 0.10%), Immigrants from Malaysia (10.0%, a difference of 0.19%), and Bangladeshi (10.0%, a difference of 0.20%).
| Demographics | Rating | Rank | Unemployment Among Ages 20 to 24 years |
| Macedonians | 97.0 /100 | #89 | Exceptional 10.0% |
| Chileans | 97.0 /100 | #90 | Exceptional 10.0% |
| Bhutanese | 96.9 /100 | #91 | Exceptional 10.0% |
| Bangladeshis | 96.9 /100 | #92 | Exceptional 10.0% |
| Immigrants | Malaysia | 96.9 /100 | #93 | Exceptional 10.0% |
| Immigrants | Micronesia | 96.6 /100 | #94 | Exceptional 10.0% |
| Scotch-Irish | 96.2 /100 | #95 | Exceptional 10.0% |
| Thais | 96.2 /100 | #96 | Exceptional 10.0% |
| Slavs | 96.1 /100 | #97 | Exceptional 10.0% |
| Japanese | 95.4 /100 | #98 | Exceptional 10.0% |
| Fijians | 95.3 /100 | #99 | Exceptional 10.0% |
| Immigrants | France | 95.2 /100 | #100 | Exceptional 10.0% |
| Laotians | 95.1 /100 | #101 | Exceptional 10.0% |
| Immigrants | Argentina | 94.9 /100 | #102 | Exceptional 10.0% |
| Irish | 94.3 /100 | #103 | Exceptional 10.0% |
Demographics Similar to Cubans by Unemployment Among Ages 20 to 24 years
In terms of unemployment among ages 20 to 24 years, the demographic groups most similar to Cubans are Immigrants from Congo (9.2%, a difference of 0.080%), Zimbabwean (9.2%, a difference of 0.10%), Slovene (9.3%, a difference of 0.47%), Immigrants from Sudan (9.3%, a difference of 0.49%), and Sudanese (9.2%, a difference of 0.55%).
| Demographics | Rating | Rank | Unemployment Among Ages 20 to 24 years |
| Norwegians | 100.0 /100 | #5 | Exceptional 9.0% |
| Immigrants | Burma/Myanmar | 100.0 /100 | #6 | Exceptional 9.1% |
| Luxembourgers | 100.0 /100 | #7 | Exceptional 9.1% |
| Somalis | 100.0 /100 | #8 | Exceptional 9.1% |
| Immigrants | Somalia | 100.0 /100 | #9 | Exceptional 9.2% |
| Sudanese | 100.0 /100 | #10 | Exceptional 9.2% |
| Zimbabweans | 100.0 /100 | #11 | Exceptional 9.2% |
| Cubans | 100.0 /100 | #12 | Exceptional 9.2% |
| Immigrants | Congo | 100.0 /100 | #13 | Exceptional 9.2% |
| Slovenes | 100.0 /100 | #14 | Exceptional 9.3% |
| Immigrants | Sudan | 100.0 /100 | #15 | Exceptional 9.3% |
| Danes | 100.0 /100 | #16 | Exceptional 9.3% |
| Czechs | 100.0 /100 | #17 | Exceptional 9.3% |
| Chinese | 100.0 /100 | #18 | Exceptional 9.4% |
| Hmong | 100.0 /100 | #19 | Exceptional 9.4% |