Yakama vs Cuban 10th Grade
COMPARE
Yakama
Cuban
10th Grade
10th Grade Comparison
Yakama
Cubans
86.9%
10TH GRADE
0.0/ 100
METRIC RATING
343rd/ 347
METRIC RANK
91.5%
10TH GRADE
0.0/ 100
METRIC RATING
298th/ 347
METRIC RANK
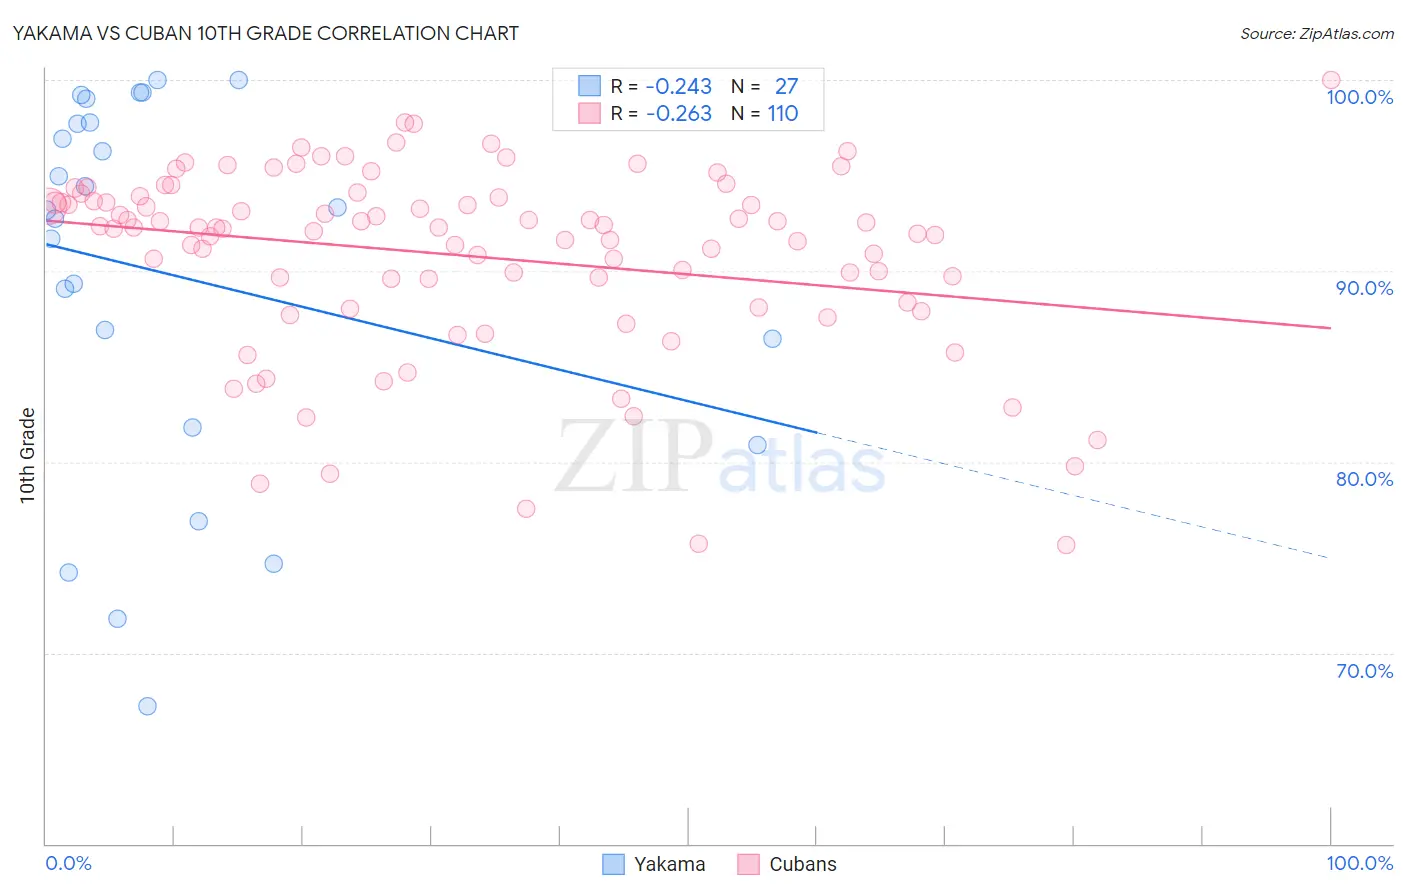
Yakama vs Cuban 10th Grade Correlation Chart
The statistical analysis conducted on geographies consisting of 19,923,144 people shows a weak negative correlation between the proportion of Yakama and percentage of population with at least 10th grade education in the United States with a correlation coefficient (R) of -0.243 and weighted average of 86.9%. Similarly, the statistical analysis conducted on geographies consisting of 449,373,052 people shows a weak negative correlation between the proportion of Cubans and percentage of population with at least 10th grade education in the United States with a correlation coefficient (R) of -0.263 and weighted average of 91.5%, a difference of 5.3%.
10th Grade Correlation Summary
| Measurement | Yakama | Cuban |
| Minimum | 67.2% | 75.7% |
| Maximum | 100.0% | 100.0% |
| Range | 32.8% | 24.3% |
| Mean | 89.8% | 90.8% |
| Median | 93.2% | 92.3% |
| Interquartile 25% (IQ1) | 81.8% | 88.3% |
| Interquartile 75% (IQ3) | 97.8% | 93.9% |
| Interquartile Range (IQR) | 16.0% | 5.5% |
| Standard Deviation (Sample) | 9.8% | 4.9% |
| Standard Deviation (Population) | 9.6% | 4.9% |
Similar Demographics by 10th Grade
Demographics Similar to Yakama by 10th Grade
In terms of 10th grade, the demographic groups most similar to Yakama are Immigrants from El Salvador (86.8%, a difference of 0.14%), Immigrants from Central America (86.6%, a difference of 0.32%), Immigrants from Guatemala (87.4%, a difference of 0.58%), Salvadoran (87.5%, a difference of 0.74%), and Spanish American Indian (86.2%, a difference of 0.77%).
| Demographics | Rating | Rank | 10th Grade |
| Hondurans | 0.0 /100 | #333 | Tragic 89.0% |
| Hispanics or Latinos | 0.0 /100 | #334 | Tragic 88.9% |
| Immigrants | Dominican Republic | 0.0 /100 | #335 | Tragic 88.7% |
| Immigrants | Honduras | 0.0 /100 | #336 | Tragic 88.5% |
| Central Americans | 0.0 /100 | #337 | Tragic 88.4% |
| Immigrants | Latin America | 0.0 /100 | #338 | Tragic 88.3% |
| Guatemalans | 0.0 /100 | #339 | Tragic 87.9% |
| Mexicans | 0.0 /100 | #340 | Tragic 87.8% |
| Salvadorans | 0.0 /100 | #341 | Tragic 87.5% |
| Immigrants | Guatemala | 0.0 /100 | #342 | Tragic 87.4% |
| Yakama | 0.0 /100 | #343 | Tragic 86.9% |
| Immigrants | El Salvador | 0.0 /100 | #344 | Tragic 86.8% |
| Immigrants | Central America | 0.0 /100 | #345 | Tragic 86.6% |
| Spanish American Indians | 0.0 /100 | #346 | Tragic 86.2% |
| Immigrants | Mexico | 0.0 /100 | #347 | Tragic 86.2% |
Demographics Similar to Cubans by 10th Grade
In terms of 10th grade, the demographic groups most similar to Cubans are Fijian (91.5%, a difference of 0.020%), Immigrants from Haiti (91.4%, a difference of 0.080%), Guyanese (91.4%, a difference of 0.12%), Immigrants from Grenada (91.6%, a difference of 0.17%), and Japanese (91.2%, a difference of 0.27%).
| Demographics | Rating | Rank | 10th Grade |
| Immigrants | West Indies | 0.0 /100 | #291 | Tragic 91.8% |
| Immigrants | Burma/Myanmar | 0.0 /100 | #292 | Tragic 91.8% |
| Indonesians | 0.0 /100 | #293 | Tragic 91.8% |
| Haitians | 0.0 /100 | #294 | Tragic 91.8% |
| Lumbee | 0.0 /100 | #295 | Tragic 91.7% |
| Immigrants | Grenada | 0.0 /100 | #296 | Tragic 91.6% |
| Fijians | 0.0 /100 | #297 | Tragic 91.5% |
| Cubans | 0.0 /100 | #298 | Tragic 91.5% |
| Immigrants | Haiti | 0.0 /100 | #299 | Tragic 91.4% |
| Guyanese | 0.0 /100 | #300 | Tragic 91.4% |
| Japanese | 0.0 /100 | #301 | Tragic 91.2% |
| Immigrants | Guyana | 0.0 /100 | #302 | Tragic 91.2% |
| Immigrants | Vietnam | 0.0 /100 | #303 | Tragic 91.2% |
| Pima | 0.0 /100 | #304 | Tragic 91.2% |
| Immigrants | Dominica | 0.0 /100 | #305 | Tragic 91.1% |