Taiwanese vs Eastern European Associate's Degree
COMPARE
Taiwanese
Eastern European
Associate's Degree
Associate's Degree Comparison
Taiwanese
Eastern Europeans
47.7%
ASSOCIATE'S DEGREE
83.3/ 100
METRIC RATING
141st/ 347
METRIC RANK
55.0%
ASSOCIATE'S DEGREE
100.0/ 100
METRIC RATING
17th/ 347
METRIC RANK
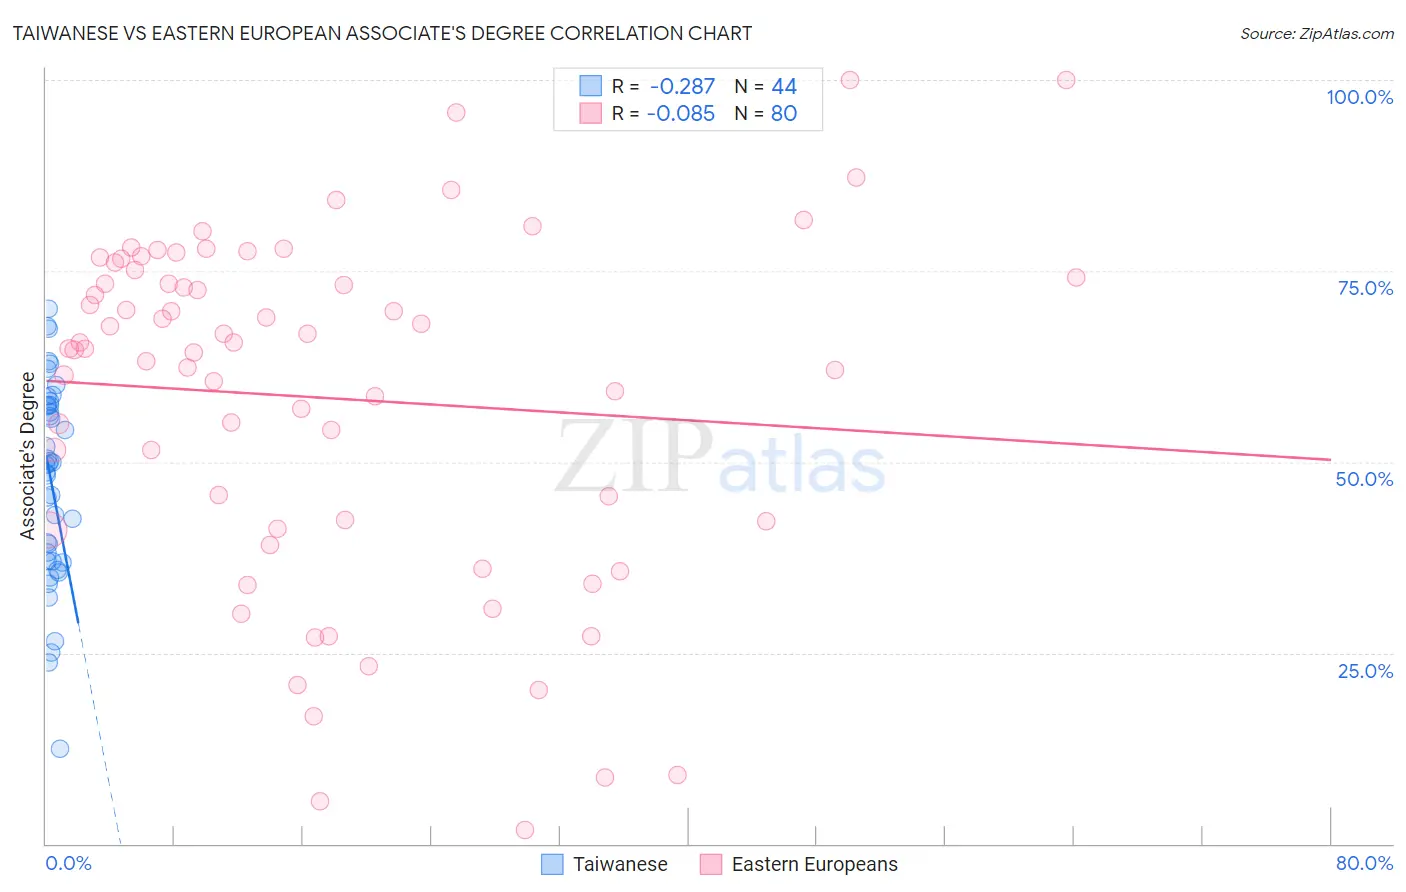
Taiwanese vs Eastern European Associate's Degree Correlation Chart
The statistical analysis conducted on geographies consisting of 31,724,936 people shows a weak negative correlation between the proportion of Taiwanese and percentage of population with at least associate's degree education in the United States with a correlation coefficient (R) of -0.287 and weighted average of 47.7%. Similarly, the statistical analysis conducted on geographies consisting of 461,211,672 people shows a slight negative correlation between the proportion of Eastern Europeans and percentage of population with at least associate's degree education in the United States with a correlation coefficient (R) of -0.085 and weighted average of 55.0%, a difference of 15.3%.
Associate's Degree Correlation Summary
| Measurement | Taiwanese | Eastern European |
| Minimum | 12.5% | 1.8% |
| Maximum | 70.0% | 100.0% |
| Range | 57.5% | 98.2% |
| Mean | 47.4% | 58.3% |
| Median | 49.7% | 64.8% |
| Interquartile 25% (IQ1) | 36.9% | 41.8% |
| Interquartile 75% (IQ3) | 57.5% | 74.6% |
| Interquartile Range (IQR) | 20.5% | 32.9% |
| Standard Deviation (Sample) | 13.1% | 22.7% |
| Standard Deviation (Population) | 12.9% | 22.6% |
Similar Demographics by Associate's Degree
Demographics Similar to Taiwanese by Associate's Degree
In terms of associate's degree, the demographic groups most similar to Taiwanese are Sierra Leonean (47.7%, a difference of 0.050%), Immigrants from Southern Europe (47.8%, a difference of 0.15%), Slovene (47.9%, a difference of 0.24%), Norwegian (47.6%, a difference of 0.28%), and Slavic (47.6%, a difference of 0.34%).
| Demographics | Rating | Rank | Associate's Degree |
| Moroccans | 89.3 /100 | #134 | Excellent 48.2% |
| Europeans | 89.0 /100 | #135 | Excellent 48.2% |
| Pakistanis | 88.0 /100 | #136 | Excellent 48.1% |
| Immigrants | Eritrea | 87.8 /100 | #137 | Excellent 48.1% |
| Poles | 87.3 /100 | #138 | Excellent 48.0% |
| Slovenes | 85.1 /100 | #139 | Excellent 47.9% |
| Immigrants | Southern Europe | 84.4 /100 | #140 | Excellent 47.8% |
| Taiwanese | 83.3 /100 | #141 | Excellent 47.7% |
| Sierra Leoneans | 82.9 /100 | #142 | Excellent 47.7% |
| Norwegians | 81.0 /100 | #143 | Excellent 47.6% |
| Slavs | 80.5 /100 | #144 | Excellent 47.6% |
| Canadians | 79.0 /100 | #145 | Good 47.5% |
| Immigrants | Sudan | 77.9 /100 | #146 | Good 47.4% |
| Danes | 77.3 /100 | #147 | Good 47.4% |
| South American Indians | 76.7 /100 | #148 | Good 47.4% |
Demographics Similar to Eastern Europeans by Associate's Degree
In terms of associate's degree, the demographic groups most similar to Eastern Europeans are Soviet Union (55.1%, a difference of 0.14%), Indian (Asian) (54.8%, a difference of 0.48%), Immigrants from Eastern Asia (55.4%, a difference of 0.61%), Immigrants from Hong Kong (55.4%, a difference of 0.64%), and Immigrants from Ireland (54.7%, a difference of 0.70%).
| Demographics | Rating | Rank | Associate's Degree |
| Cypriots | 100.0 /100 | #10 | Exceptional 56.4% |
| Immigrants | Australia | 100.0 /100 | #11 | Exceptional 55.8% |
| Immigrants | South Central Asia | 100.0 /100 | #12 | Exceptional 55.7% |
| Immigrants | China | 100.0 /100 | #13 | Exceptional 55.5% |
| Immigrants | Hong Kong | 100.0 /100 | #14 | Exceptional 55.4% |
| Immigrants | Eastern Asia | 100.0 /100 | #15 | Exceptional 55.4% |
| Soviet Union | 100.0 /100 | #16 | Exceptional 55.1% |
| Eastern Europeans | 100.0 /100 | #17 | Exceptional 55.0% |
| Indians (Asian) | 100.0 /100 | #18 | Exceptional 54.8% |
| Immigrants | Ireland | 100.0 /100 | #19 | Exceptional 54.7% |
| Cambodians | 100.0 /100 | #20 | Exceptional 54.6% |
| Immigrants | Sweden | 100.0 /100 | #21 | Exceptional 54.6% |
| Immigrants | Japan | 100.0 /100 | #22 | Exceptional 54.6% |
| Burmese | 100.0 /100 | #23 | Exceptional 54.6% |
| Immigrants | Korea | 100.0 /100 | #24 | Exceptional 54.5% |