Taiwanese vs Portuguese Associate's Degree
COMPARE
Taiwanese
Portuguese
Associate's Degree
Associate's Degree Comparison
Taiwanese
Portuguese
47.7%
ASSOCIATE'S DEGREE
83.3/ 100
METRIC RATING
141st/ 347
METRIC RANK
44.1%
ASSOCIATE'S DEGREE
7.2/ 100
METRIC RATING
220th/ 347
METRIC RANK
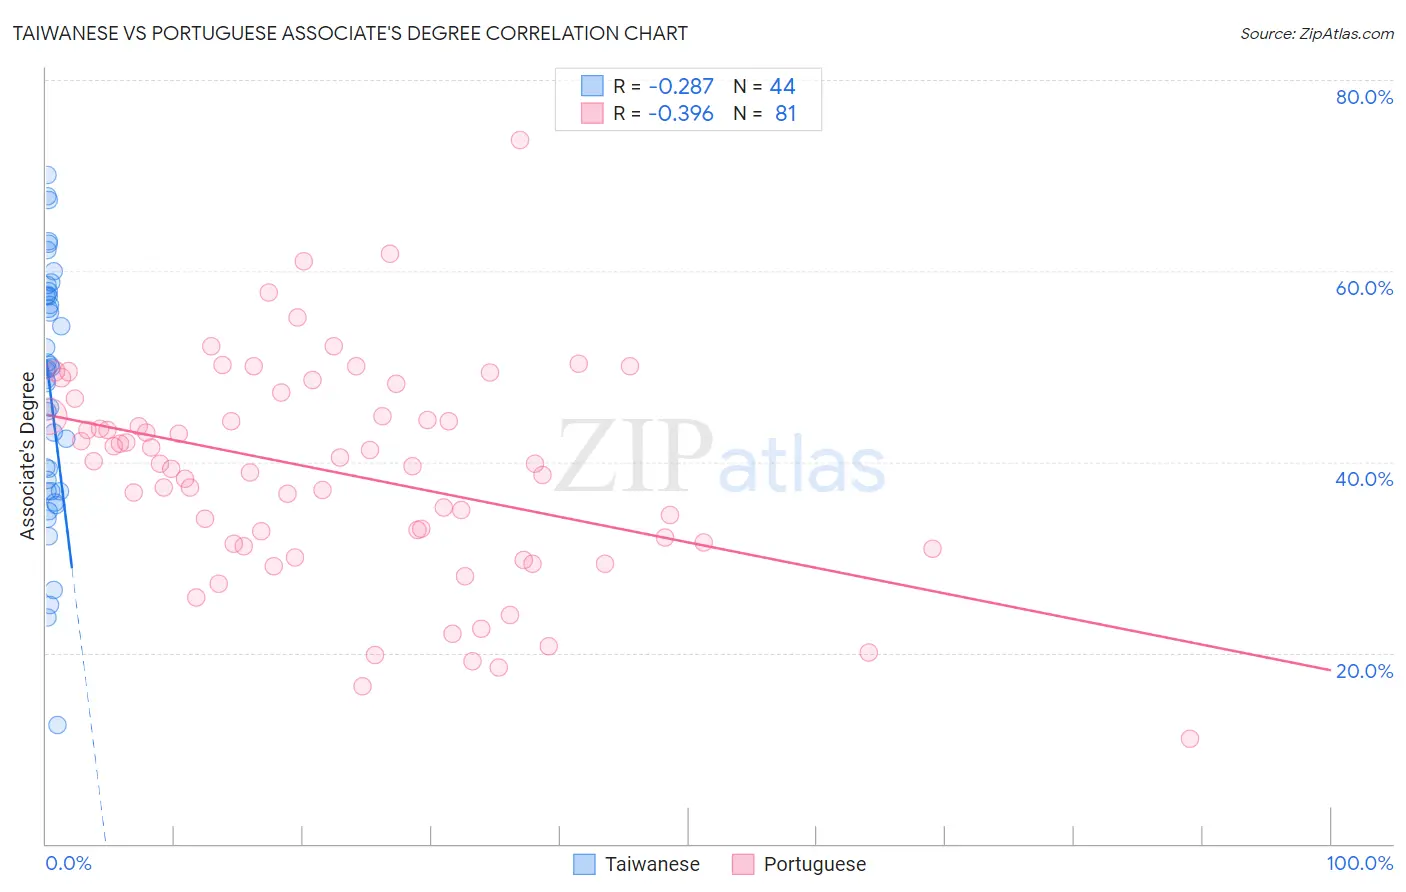
Taiwanese vs Portuguese Associate's Degree Correlation Chart
The statistical analysis conducted on geographies consisting of 31,724,936 people shows a weak negative correlation between the proportion of Taiwanese and percentage of population with at least associate's degree education in the United States with a correlation coefficient (R) of -0.287 and weighted average of 47.7%. Similarly, the statistical analysis conducted on geographies consisting of 450,325,825 people shows a mild negative correlation between the proportion of Portuguese and percentage of population with at least associate's degree education in the United States with a correlation coefficient (R) of -0.396 and weighted average of 44.1%, a difference of 8.2%.
Associate's Degree Correlation Summary
| Measurement | Taiwanese | Portuguese |
| Minimum | 12.5% | 11.0% |
| Maximum | 70.0% | 73.7% |
| Range | 57.5% | 62.7% |
| Mean | 47.4% | 38.8% |
| Median | 49.7% | 39.8% |
| Interquartile 25% (IQ1) | 36.9% | 31.3% |
| Interquartile 75% (IQ3) | 57.5% | 45.7% |
| Interquartile Range (IQR) | 20.5% | 14.4% |
| Standard Deviation (Sample) | 13.1% | 11.3% |
| Standard Deviation (Population) | 12.9% | 11.2% |
Similar Demographics by Associate's Degree
Demographics Similar to Taiwanese by Associate's Degree
In terms of associate's degree, the demographic groups most similar to Taiwanese are Sierra Leonean (47.7%, a difference of 0.050%), Immigrants from Southern Europe (47.8%, a difference of 0.15%), Slovene (47.9%, a difference of 0.24%), Norwegian (47.6%, a difference of 0.28%), and Slavic (47.6%, a difference of 0.34%).
| Demographics | Rating | Rank | Associate's Degree |
| Moroccans | 89.3 /100 | #134 | Excellent 48.2% |
| Europeans | 89.0 /100 | #135 | Excellent 48.2% |
| Pakistanis | 88.0 /100 | #136 | Excellent 48.1% |
| Immigrants | Eritrea | 87.8 /100 | #137 | Excellent 48.1% |
| Poles | 87.3 /100 | #138 | Excellent 48.0% |
| Slovenes | 85.1 /100 | #139 | Excellent 47.9% |
| Immigrants | Southern Europe | 84.4 /100 | #140 | Excellent 47.8% |
| Taiwanese | 83.3 /100 | #141 | Excellent 47.7% |
| Sierra Leoneans | 82.9 /100 | #142 | Excellent 47.7% |
| Norwegians | 81.0 /100 | #143 | Excellent 47.6% |
| Slavs | 80.5 /100 | #144 | Excellent 47.6% |
| Canadians | 79.0 /100 | #145 | Good 47.5% |
| Immigrants | Sudan | 77.9 /100 | #146 | Good 47.4% |
| Danes | 77.3 /100 | #147 | Good 47.4% |
| South American Indians | 76.7 /100 | #148 | Good 47.4% |
Demographics Similar to Portuguese by Associate's Degree
In terms of associate's degree, the demographic groups most similar to Portuguese are White/Caucasian (44.2%, a difference of 0.070%), Immigrants from Western Africa (44.1%, a difference of 0.20%), Barbadian (43.9%, a difference of 0.47%), Spanish (44.4%, a difference of 0.55%), and Subsaharan African (43.9%, a difference of 0.57%).
| Demographics | Rating | Rank | Associate's Degree |
| Immigrants | Ghana | 14.2 /100 | #213 | Poor 44.8% |
| Immigrants | Middle Africa | 12.7 /100 | #214 | Poor 44.7% |
| Immigrants | Panama | 12.4 /100 | #215 | Poor 44.7% |
| Immigrants | Nigeria | 11.4 /100 | #216 | Poor 44.6% |
| Immigrants | Immigrants | 10.5 /100 | #217 | Poor 44.5% |
| Spanish | 9.4 /100 | #218 | Tragic 44.4% |
| Whites/Caucasians | 7.5 /100 | #219 | Tragic 44.2% |
| Portuguese | 7.2 /100 | #220 | Tragic 44.1% |
| Immigrants | Western Africa | 6.6 /100 | #221 | Tragic 44.1% |
| Barbadians | 5.8 /100 | #222 | Tragic 43.9% |
| Sub-Saharan Africans | 5.5 /100 | #223 | Tragic 43.9% |
| West Indians | 5.2 /100 | #224 | Tragic 43.8% |
| Guamanians/Chamorros | 4.8 /100 | #225 | Tragic 43.8% |
| Immigrants | Burma/Myanmar | 4.3 /100 | #226 | Tragic 43.7% |
| Trinidadians and Tobagonians | 4.0 /100 | #227 | Tragic 43.6% |