Pennsylvania German vs Eastern European Associate's Degree
COMPARE
Pennsylvania German
Eastern European
Associate's Degree
Associate's Degree Comparison
Pennsylvania Germans
Eastern Europeans
37.2%
ASSOCIATE'S DEGREE
0.0/ 100
METRIC RATING
322nd/ 347
METRIC RANK
55.0%
ASSOCIATE'S DEGREE
100.0/ 100
METRIC RATING
17th/ 347
METRIC RANK
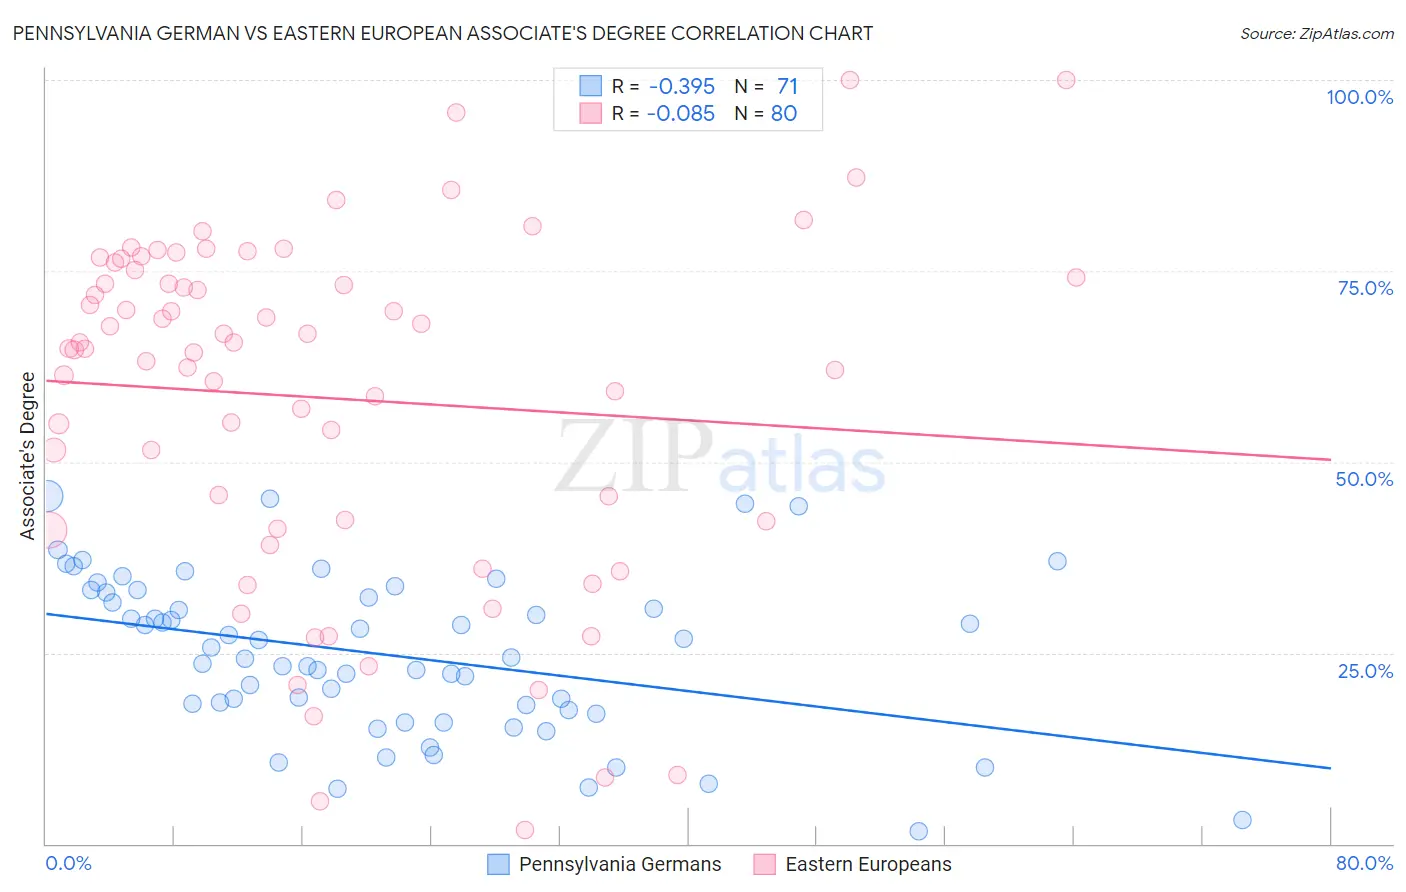
Pennsylvania German vs Eastern European Associate's Degree Correlation Chart
The statistical analysis conducted on geographies consisting of 234,093,670 people shows a mild negative correlation between the proportion of Pennsylvania Germans and percentage of population with at least associate's degree education in the United States with a correlation coefficient (R) of -0.395 and weighted average of 37.2%. Similarly, the statistical analysis conducted on geographies consisting of 461,211,672 people shows a slight negative correlation between the proportion of Eastern Europeans and percentage of population with at least associate's degree education in the United States with a correlation coefficient (R) of -0.085 and weighted average of 55.0%, a difference of 47.9%.
Associate's Degree Correlation Summary
| Measurement | Pennsylvania German | Eastern European |
| Minimum | 1.6% | 1.8% |
| Maximum | 45.5% | 100.0% |
| Range | 44.0% | 98.2% |
| Mean | 24.7% | 58.3% |
| Median | 24.4% | 64.8% |
| Interquartile 25% (IQ1) | 17.5% | 41.8% |
| Interquartile 75% (IQ3) | 32.9% | 74.6% |
| Interquartile Range (IQR) | 15.3% | 32.9% |
| Standard Deviation (Sample) | 10.3% | 22.7% |
| Standard Deviation (Population) | 10.2% | 22.6% |
Similar Demographics by Associate's Degree
Demographics Similar to Pennsylvania Germans by Associate's Degree
In terms of associate's degree, the demographic groups most similar to Pennsylvania Germans are Immigrants from Yemen (37.3%, a difference of 0.29%), Cajun (37.4%, a difference of 0.40%), Fijian (37.4%, a difference of 0.43%), Alaska Native (37.5%, a difference of 0.66%), and Yaqui (37.6%, a difference of 0.89%).
| Demographics | Rating | Rank | Associate's Degree |
| Creek | 0.0 /100 | #315 | Tragic 37.6% |
| Crow | 0.0 /100 | #316 | Tragic 37.6% |
| Yaqui | 0.0 /100 | #317 | Tragic 37.6% |
| Alaska Natives | 0.0 /100 | #318 | Tragic 37.5% |
| Fijians | 0.0 /100 | #319 | Tragic 37.4% |
| Cajuns | 0.0 /100 | #320 | Tragic 37.4% |
| Immigrants | Yemen | 0.0 /100 | #321 | Tragic 37.3% |
| Pennsylvania Germans | 0.0 /100 | #322 | Tragic 37.2% |
| Immigrants | Cabo Verde | 0.0 /100 | #323 | Tragic 36.8% |
| Arapaho | 0.0 /100 | #324 | Tragic 36.7% |
| Menominee | 0.0 /100 | #325 | Tragic 36.7% |
| Kiowa | 0.0 /100 | #326 | Tragic 36.5% |
| Dutch West Indians | 0.0 /100 | #327 | Tragic 36.5% |
| Alaskan Athabascans | 0.0 /100 | #328 | Tragic 36.5% |
| Paiute | 0.0 /100 | #329 | Tragic 36.4% |
Demographics Similar to Eastern Europeans by Associate's Degree
In terms of associate's degree, the demographic groups most similar to Eastern Europeans are Soviet Union (55.1%, a difference of 0.14%), Indian (Asian) (54.8%, a difference of 0.48%), Immigrants from Eastern Asia (55.4%, a difference of 0.61%), Immigrants from Hong Kong (55.4%, a difference of 0.64%), and Immigrants from Ireland (54.7%, a difference of 0.70%).
| Demographics | Rating | Rank | Associate's Degree |
| Cypriots | 100.0 /100 | #10 | Exceptional 56.4% |
| Immigrants | Australia | 100.0 /100 | #11 | Exceptional 55.8% |
| Immigrants | South Central Asia | 100.0 /100 | #12 | Exceptional 55.7% |
| Immigrants | China | 100.0 /100 | #13 | Exceptional 55.5% |
| Immigrants | Hong Kong | 100.0 /100 | #14 | Exceptional 55.4% |
| Immigrants | Eastern Asia | 100.0 /100 | #15 | Exceptional 55.4% |
| Soviet Union | 100.0 /100 | #16 | Exceptional 55.1% |
| Eastern Europeans | 100.0 /100 | #17 | Exceptional 55.0% |
| Indians (Asian) | 100.0 /100 | #18 | Exceptional 54.8% |
| Immigrants | Ireland | 100.0 /100 | #19 | Exceptional 54.7% |
| Cambodians | 100.0 /100 | #20 | Exceptional 54.6% |
| Immigrants | Sweden | 100.0 /100 | #21 | Exceptional 54.6% |
| Immigrants | Japan | 100.0 /100 | #22 | Exceptional 54.6% |
| Burmese | 100.0 /100 | #23 | Exceptional 54.6% |
| Immigrants | Korea | 100.0 /100 | #24 | Exceptional 54.5% |