Immigrants from Denmark vs Eastern European Associate's Degree
COMPARE
Immigrants from Denmark
Eastern European
Associate's Degree
Associate's Degree Comparison
Immigrants from Denmark
Eastern Europeans
53.1%
ASSOCIATE'S DEGREE
100.0/ 100
METRIC RATING
37th/ 347
METRIC RANK
55.0%
ASSOCIATE'S DEGREE
100.0/ 100
METRIC RATING
17th/ 347
METRIC RANK
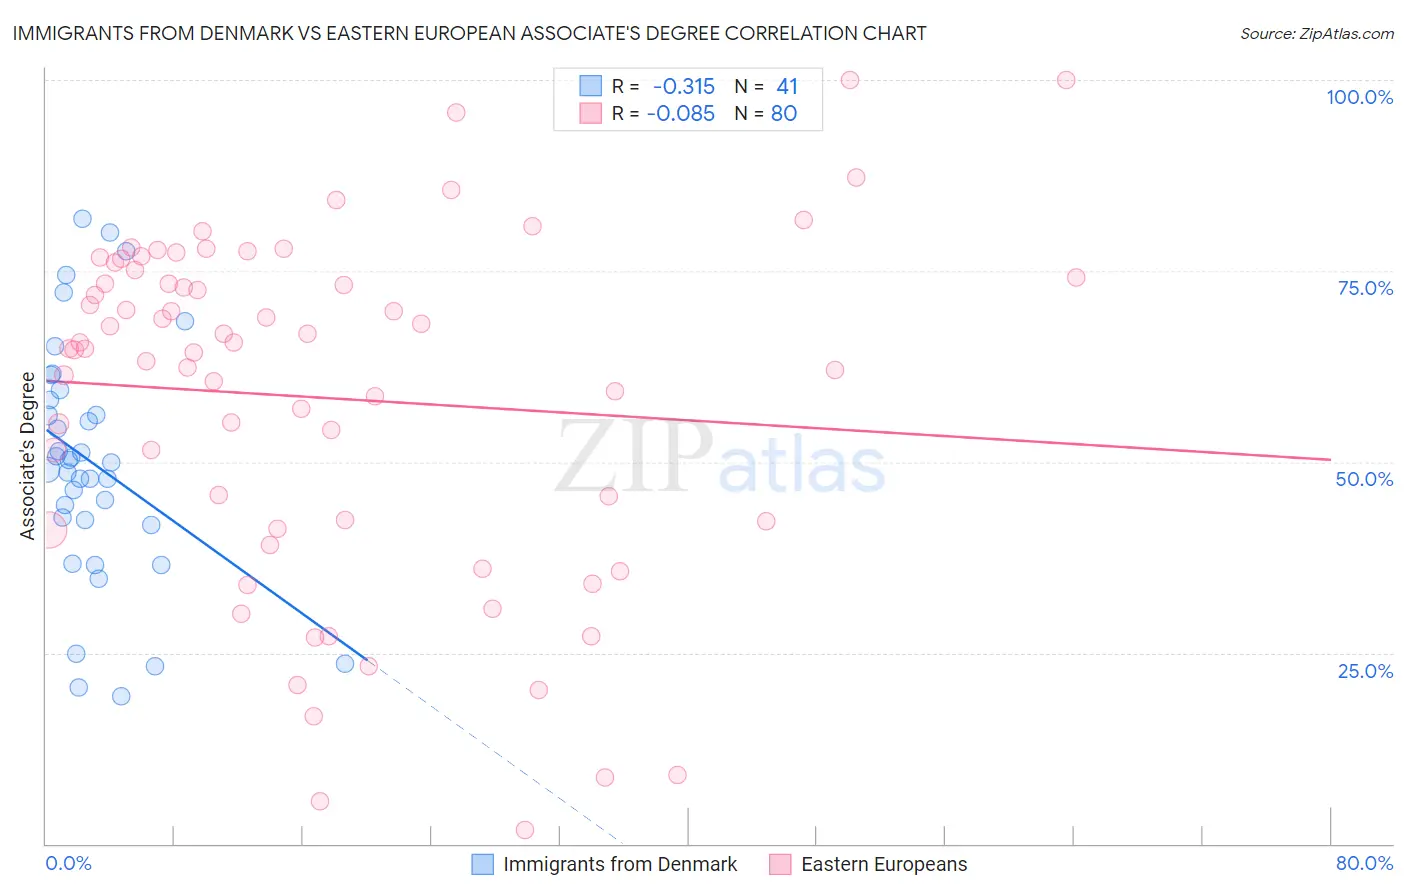
Immigrants from Denmark vs Eastern European Associate's Degree Correlation Chart
The statistical analysis conducted on geographies consisting of 136,428,731 people shows a mild negative correlation between the proportion of Immigrants from Denmark and percentage of population with at least associate's degree education in the United States with a correlation coefficient (R) of -0.315 and weighted average of 53.1%. Similarly, the statistical analysis conducted on geographies consisting of 461,211,672 people shows a slight negative correlation between the proportion of Eastern Europeans and percentage of population with at least associate's degree education in the United States with a correlation coefficient (R) of -0.085 and weighted average of 55.0%, a difference of 3.7%.
Associate's Degree Correlation Summary
| Measurement | Immigrants from Denmark | Eastern European |
| Minimum | 19.3% | 1.8% |
| Maximum | 81.9% | 100.0% |
| Range | 62.5% | 98.2% |
| Mean | 49.9% | 58.3% |
| Median | 50.0% | 64.8% |
| Interquartile 25% (IQ1) | 42.1% | 41.8% |
| Interquartile 75% (IQ3) | 58.7% | 74.6% |
| Interquartile Range (IQR) | 16.6% | 32.9% |
| Standard Deviation (Sample) | 15.6% | 22.7% |
| Standard Deviation (Population) | 15.4% | 22.6% |
Demographics Similar to Immigrants from Denmark and Eastern Europeans by Associate's Degree
In terms of associate's degree, the demographic groups most similar to Immigrants from Denmark are Immigrants from Russia (53.1%, a difference of 0.080%), Russian (53.2%, a difference of 0.36%), Bulgarian (53.3%, a difference of 0.43%), Israeli (53.4%, a difference of 0.62%), and Immigrants from Turkey (53.4%, a difference of 0.74%). Similarly, the demographic groups most similar to Eastern Europeans are Indian (Asian) (54.8%, a difference of 0.48%), Immigrants from Ireland (54.7%, a difference of 0.70%), Cambodian (54.6%, a difference of 0.72%), Immigrants from Sweden (54.6%, a difference of 0.78%), and Immigrants from Japan (54.6%, a difference of 0.82%).
| Demographics | Rating | Rank | Associate's Degree |
| Eastern Europeans | 100.0 /100 | #17 | Exceptional 55.0% |
| Indians (Asian) | 100.0 /100 | #18 | Exceptional 54.8% |
| Immigrants | Ireland | 100.0 /100 | #19 | Exceptional 54.7% |
| Cambodians | 100.0 /100 | #20 | Exceptional 54.6% |
| Immigrants | Sweden | 100.0 /100 | #21 | Exceptional 54.6% |
| Immigrants | Japan | 100.0 /100 | #22 | Exceptional 54.6% |
| Burmese | 100.0 /100 | #23 | Exceptional 54.6% |
| Immigrants | Korea | 100.0 /100 | #24 | Exceptional 54.5% |
| Immigrants | Switzerland | 100.0 /100 | #25 | Exceptional 54.5% |
| Immigrants | Belgium | 100.0 /100 | #26 | Exceptional 54.5% |
| Latvians | 100.0 /100 | #27 | Exceptional 53.9% |
| Turks | 100.0 /100 | #28 | Exceptional 53.9% |
| Immigrants | France | 100.0 /100 | #29 | Exceptional 53.9% |
| Immigrants | Sri Lanka | 100.0 /100 | #30 | Exceptional 53.7% |
| Immigrants | Northern Europe | 100.0 /100 | #31 | Exceptional 53.5% |
| Immigrants | Turkey | 100.0 /100 | #32 | Exceptional 53.4% |
| Israelis | 100.0 /100 | #33 | Exceptional 53.4% |
| Bulgarians | 100.0 /100 | #34 | Exceptional 53.3% |
| Russians | 100.0 /100 | #35 | Exceptional 53.2% |
| Immigrants | Russia | 100.0 /100 | #36 | Exceptional 53.1% |
| Immigrants | Denmark | 100.0 /100 | #37 | Exceptional 53.1% |