Syrian vs Central American Indian Master's Degree
COMPARE
Syrian
Central American Indian
Master's Degree
Master's Degree Comparison
Syrians
Central American Indians
16.8%
MASTER'S DEGREE
98.3/ 100
METRIC RATING
105th/ 347
METRIC RANK
12.4%
MASTER'S DEGREE
0.5/ 100
METRIC RATING
263rd/ 347
METRIC RANK
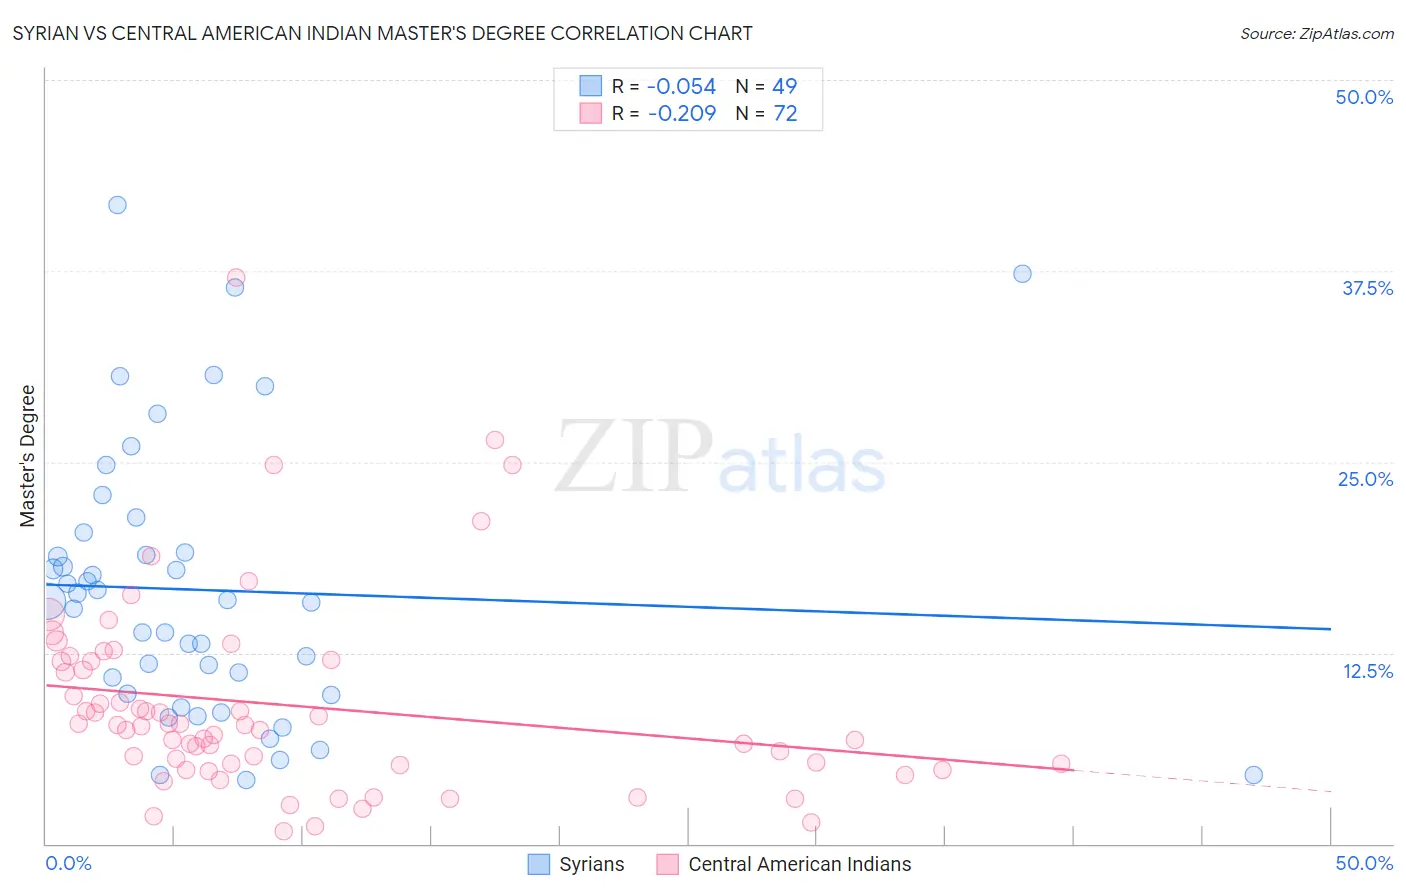
Syrian vs Central American Indian Master's Degree Correlation Chart
The statistical analysis conducted on geographies consisting of 266,236,356 people shows a slight negative correlation between the proportion of Syrians and percentage of population with at least master's degree education in the United States with a correlation coefficient (R) of -0.054 and weighted average of 16.8%. Similarly, the statistical analysis conducted on geographies consisting of 326,067,650 people shows a weak negative correlation between the proportion of Central American Indians and percentage of population with at least master's degree education in the United States with a correlation coefficient (R) of -0.209 and weighted average of 12.4%, a difference of 35.5%.
Master's Degree Correlation Summary
| Measurement | Syrian | Central American Indian |
| Minimum | 4.2% | 0.78% |
| Maximum | 41.8% | 37.0% |
| Range | 37.6% | 36.3% |
| Mean | 16.6% | 9.1% |
| Median | 15.9% | 7.7% |
| Interquartile 25% (IQ1) | 9.8% | 5.2% |
| Interquartile 75% (IQ3) | 19.7% | 11.9% |
| Interquartile Range (IQR) | 9.9% | 6.7% |
| Standard Deviation (Sample) | 8.9% | 6.4% |
| Standard Deviation (Population) | 8.8% | 6.4% |
Similar Demographics by Master's Degree
Demographics Similar to Syrians by Master's Degree
In terms of master's degree, the demographic groups most similar to Syrians are Ukrainian (16.9%, a difference of 0.10%), Alsatian (16.9%, a difference of 0.22%), Immigrants from Albania (16.8%, a difference of 0.28%), Armenian (16.8%, a difference of 0.37%), and Sierra Leonean (16.8%, a difference of 0.40%).
| Demographics | Rating | Rank | Master's Degree |
| Immigrants | Ukraine | 98.8 /100 | #98 | Exceptional 17.0% |
| Laotians | 98.8 /100 | #99 | Exceptional 17.0% |
| Albanians | 98.7 /100 | #100 | Exceptional 17.0% |
| Immigrants | Nepal | 98.6 /100 | #101 | Exceptional 17.0% |
| Chileans | 98.6 /100 | #102 | Exceptional 16.9% |
| Alsatians | 98.4 /100 | #103 | Exceptional 16.9% |
| Ukrainians | 98.3 /100 | #104 | Exceptional 16.9% |
| Syrians | 98.3 /100 | #105 | Exceptional 16.8% |
| Immigrants | Albania | 98.1 /100 | #106 | Exceptional 16.8% |
| Armenians | 98.0 /100 | #107 | Exceptional 16.8% |
| Sierra Leoneans | 98.0 /100 | #108 | Exceptional 16.8% |
| Moroccans | 98.0 /100 | #109 | Exceptional 16.8% |
| Immigrants | Chile | 98.0 /100 | #110 | Exceptional 16.8% |
| Austrians | 97.8 /100 | #111 | Exceptional 16.7% |
| Macedonians | 97.7 /100 | #112 | Exceptional 16.7% |
Demographics Similar to Central American Indians by Master's Degree
In terms of master's degree, the demographic groups most similar to Central American Indians are Belizean (12.4%, a difference of 0.17%), Immigrants from Fiji (12.4%, a difference of 0.19%), Nicaraguan (12.5%, a difference of 0.23%), Bahamian (12.4%, a difference of 0.34%), and Tongan (12.5%, a difference of 0.42%).
| Demographics | Rating | Rank | Master's Degree |
| Immigrants | Portugal | 0.8 /100 | #256 | Tragic 12.6% |
| Osage | 0.7 /100 | #257 | Tragic 12.6% |
| Immigrants | Liberia | 0.6 /100 | #258 | Tragic 12.5% |
| Japanese | 0.6 /100 | #259 | Tragic 12.5% |
| Dominicans | 0.6 /100 | #260 | Tragic 12.5% |
| Tongans | 0.6 /100 | #261 | Tragic 12.5% |
| Nicaraguans | 0.6 /100 | #262 | Tragic 12.5% |
| Central American Indians | 0.5 /100 | #263 | Tragic 12.4% |
| Belizeans | 0.5 /100 | #264 | Tragic 12.4% |
| Immigrants | Fiji | 0.5 /100 | #265 | Tragic 12.4% |
| Bahamians | 0.5 /100 | #266 | Tragic 12.4% |
| Americans | 0.4 /100 | #267 | Tragic 12.3% |
| Native Hawaiians | 0.4 /100 | #268 | Tragic 12.3% |
| Central Americans | 0.3 /100 | #269 | Tragic 12.2% |
| Salvadorans | 0.3 /100 | #270 | Tragic 12.2% |