Syrian vs Cree Master's Degree
COMPARE
Syrian
Cree
Master's Degree
Master's Degree Comparison
Syrians
Cree
16.8%
MASTER'S DEGREE
98.3/ 100
METRIC RATING
105th/ 347
METRIC RANK
12.8%
MASTER'S DEGREE
1.3/ 100
METRIC RATING
249th/ 347
METRIC RANK
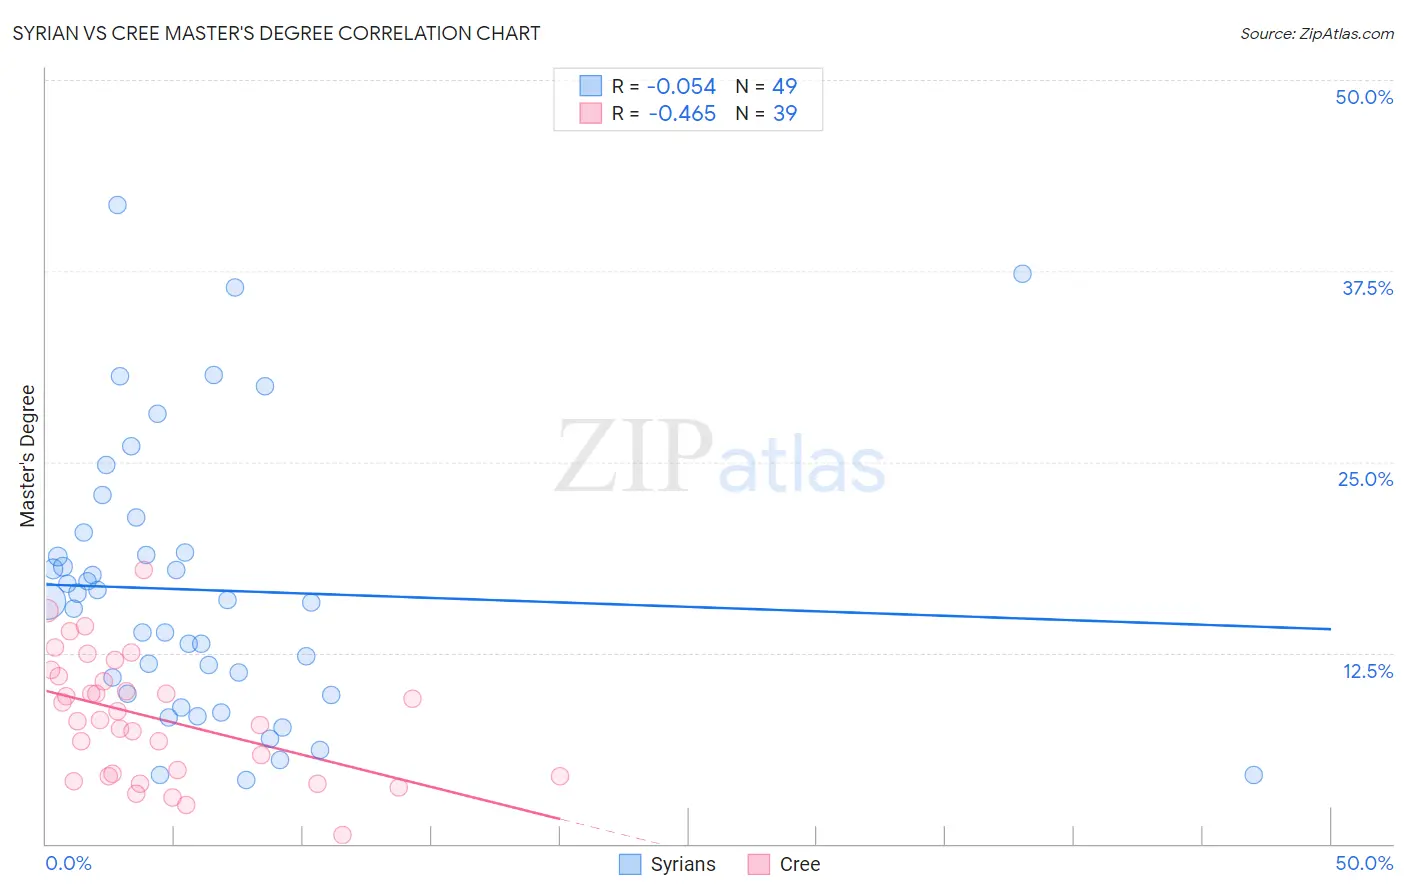
Syrian vs Cree Master's Degree Correlation Chart
The statistical analysis conducted on geographies consisting of 266,236,356 people shows a slight negative correlation between the proportion of Syrians and percentage of population with at least master's degree education in the United States with a correlation coefficient (R) of -0.054 and weighted average of 16.8%. Similarly, the statistical analysis conducted on geographies consisting of 76,203,743 people shows a moderate negative correlation between the proportion of Cree and percentage of population with at least master's degree education in the United States with a correlation coefficient (R) of -0.465 and weighted average of 12.8%, a difference of 31.2%.
Master's Degree Correlation Summary
| Measurement | Syrian | Cree |
| Minimum | 4.2% | 0.59% |
| Maximum | 41.8% | 17.9% |
| Range | 37.6% | 17.3% |
| Mean | 16.6% | 8.2% |
| Median | 15.9% | 8.1% |
| Interquartile 25% (IQ1) | 9.8% | 4.4% |
| Interquartile 75% (IQ3) | 19.7% | 11.0% |
| Interquartile Range (IQR) | 9.9% | 6.5% |
| Standard Deviation (Sample) | 8.9% | 4.0% |
| Standard Deviation (Population) | 8.8% | 3.9% |
Similar Demographics by Master's Degree
Demographics Similar to Syrians by Master's Degree
In terms of master's degree, the demographic groups most similar to Syrians are Ukrainian (16.9%, a difference of 0.10%), Alsatian (16.9%, a difference of 0.22%), Immigrants from Albania (16.8%, a difference of 0.28%), Armenian (16.8%, a difference of 0.37%), and Sierra Leonean (16.8%, a difference of 0.40%).
| Demographics | Rating | Rank | Master's Degree |
| Immigrants | Ukraine | 98.8 /100 | #98 | Exceptional 17.0% |
| Laotians | 98.8 /100 | #99 | Exceptional 17.0% |
| Albanians | 98.7 /100 | #100 | Exceptional 17.0% |
| Immigrants | Nepal | 98.6 /100 | #101 | Exceptional 17.0% |
| Chileans | 98.6 /100 | #102 | Exceptional 16.9% |
| Alsatians | 98.4 /100 | #103 | Exceptional 16.9% |
| Ukrainians | 98.3 /100 | #104 | Exceptional 16.9% |
| Syrians | 98.3 /100 | #105 | Exceptional 16.8% |
| Immigrants | Albania | 98.1 /100 | #106 | Exceptional 16.8% |
| Armenians | 98.0 /100 | #107 | Exceptional 16.8% |
| Sierra Leoneans | 98.0 /100 | #108 | Exceptional 16.8% |
| Moroccans | 98.0 /100 | #109 | Exceptional 16.8% |
| Immigrants | Chile | 98.0 /100 | #110 | Exceptional 16.8% |
| Austrians | 97.8 /100 | #111 | Exceptional 16.7% |
| Macedonians | 97.7 /100 | #112 | Exceptional 16.7% |
Demographics Similar to Cree by Master's Degree
In terms of master's degree, the demographic groups most similar to Cree are Liberian (12.8%, a difference of 0.010%), Tlingit-Haida (12.8%, a difference of 0.040%), African (12.9%, a difference of 0.31%), Iroquois (12.9%, a difference of 0.40%), and Immigrants from Cambodia (12.9%, a difference of 0.43%).
| Demographics | Rating | Rank | Master's Degree |
| Spanish Americans | 1.9 /100 | #242 | Tragic 13.0% |
| Immigrants | Jamaica | 1.9 /100 | #243 | Tragic 13.0% |
| Delaware | 1.7 /100 | #244 | Tragic 13.0% |
| Immigrants | Bahamas | 1.4 /100 | #245 | Tragic 12.9% |
| Immigrants | Cambodia | 1.4 /100 | #246 | Tragic 12.9% |
| Iroquois | 1.4 /100 | #247 | Tragic 12.9% |
| Africans | 1.4 /100 | #248 | Tragic 12.9% |
| Cree | 1.3 /100 | #249 | Tragic 12.8% |
| Liberians | 1.3 /100 | #250 | Tragic 12.8% |
| Tlingit-Haida | 1.3 /100 | #251 | Tragic 12.8% |
| French American Indians | 1.0 /100 | #252 | Tragic 12.7% |
| Immigrants | Dominica | 0.8 /100 | #253 | Tragic 12.6% |
| Indonesians | 0.8 /100 | #254 | Tragic 12.6% |
| Immigrants | Congo | 0.8 /100 | #255 | Tragic 12.6% |
| Immigrants | Portugal | 0.8 /100 | #256 | Tragic 12.6% |