Venezuelan vs Ghanaian No Schooling Completed
COMPARE
Venezuelan
Ghanaian
No Schooling Completed
No Schooling Completed Comparison
Venezuelans
Ghanaians
2.0%
NO SCHOOLING COMPLETED
81.5/ 100
METRIC RATING
142nd/ 347
METRIC RANK
2.6%
NO SCHOOLING COMPLETED
0.1/ 100
METRIC RATING
274th/ 347
METRIC RANK
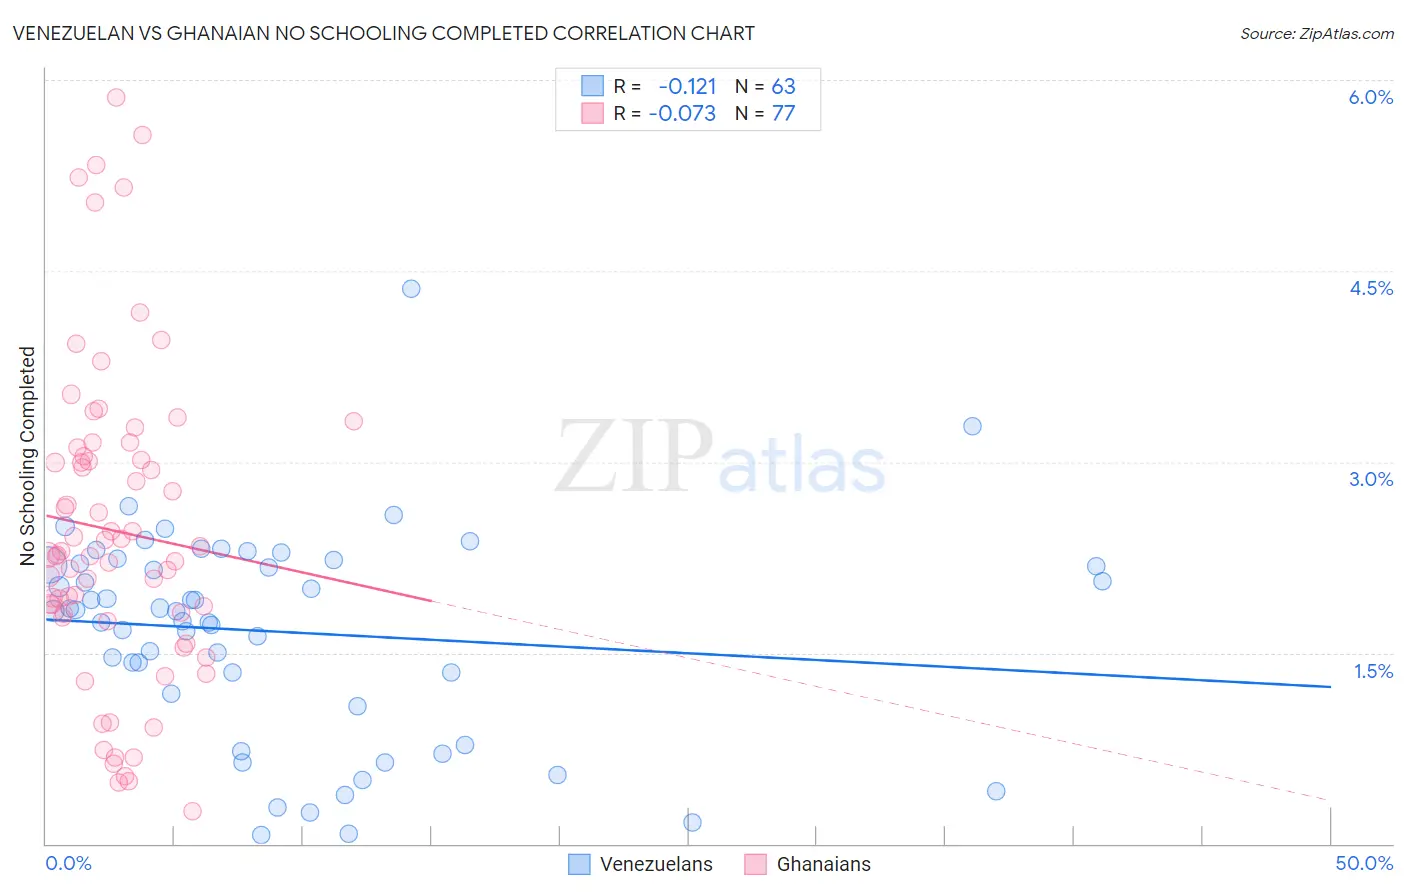
Venezuelan vs Ghanaian No Schooling Completed Correlation Chart
The statistical analysis conducted on geographies consisting of 304,404,402 people shows a poor negative correlation between the proportion of Venezuelans and percentage of population with no schooling in the United States with a correlation coefficient (R) of -0.121 and weighted average of 2.0%. Similarly, the statistical analysis conducted on geographies consisting of 189,718,385 people shows a slight negative correlation between the proportion of Ghanaians and percentage of population with no schooling in the United States with a correlation coefficient (R) of -0.073 and weighted average of 2.6%, a difference of 28.7%.
No Schooling Completed Correlation Summary
| Measurement | Venezuelan | Ghanaian |
| Minimum | 0.072% | 0.26% |
| Maximum | 4.4% | 5.9% |
| Range | 4.3% | 5.6% |
| Mean | 1.7% | 2.5% |
| Median | 1.8% | 2.3% |
| Interquartile 25% (IQ1) | 1.2% | 1.8% |
| Interquartile 75% (IQ3) | 2.2% | 3.1% |
| Interquartile Range (IQR) | 1.0% | 1.3% |
| Standard Deviation (Sample) | 0.82% | 1.2% |
| Standard Deviation (Population) | 0.81% | 1.2% |
Similar Demographics by No Schooling Completed
Demographics Similar to Venezuelans by No Schooling Completed
In terms of no schooling completed, the demographic groups most similar to Venezuelans are Immigrants from South Central Asia (2.0%, a difference of 0.35%), Immigrants from Greece (2.0%, a difference of 0.49%), Marshallese (2.0%, a difference of 0.50%), Alsatian (2.0%, a difference of 0.55%), and Immigrants from Iran (2.0%, a difference of 0.55%).
| Demographics | Rating | Rank | No Schooling Completed |
| Hmong | 88.5 /100 | #135 | Excellent 1.9% |
| Burmese | 88.2 /100 | #136 | Excellent 1.9% |
| Filipinos | 85.5 /100 | #137 | Excellent 2.0% |
| Immigrants | Israel | 85.4 /100 | #138 | Excellent 2.0% |
| Jordanians | 84.5 /100 | #139 | Excellent 2.0% |
| Marshallese | 83.5 /100 | #140 | Excellent 2.0% |
| Immigrants | Greece | 83.5 /100 | #141 | Excellent 2.0% |
| Venezuelans | 81.5 /100 | #142 | Excellent 2.0% |
| Immigrants | South Central Asia | 80.0 /100 | #143 | Good 2.0% |
| Alsatians | 79.1 /100 | #144 | Good 2.0% |
| Immigrants | Iran | 79.0 /100 | #145 | Good 2.0% |
| Immigrants | Moldova | 78.0 /100 | #146 | Good 2.0% |
| Soviet Union | 77.1 /100 | #147 | Good 2.0% |
| Shoshone | 76.7 /100 | #148 | Good 2.0% |
| Immigrants | North Macedonia | 75.9 /100 | #149 | Good 2.0% |
Demographics Similar to Ghanaians by No Schooling Completed
In terms of no schooling completed, the demographic groups most similar to Ghanaians are Immigrants from China (2.6%, a difference of 0.18%), Immigrants from Cameroon (2.5%, a difference of 0.37%), Immigrants from Western Africa (2.6%, a difference of 0.74%), Immigrants from Philippines (2.6%, a difference of 0.80%), and Immigrants from Uzbekistan (2.6%, a difference of 1.0%).
| Demographics | Rating | Rank | No Schooling Completed |
| Yuman | 0.4 /100 | #267 | Tragic 2.5% |
| Taiwanese | 0.3 /100 | #268 | Tragic 2.5% |
| Immigrants | Nigeria | 0.2 /100 | #269 | Tragic 2.5% |
| Immigrants | Peru | 0.2 /100 | #270 | Tragic 2.5% |
| Cubans | 0.2 /100 | #271 | Tragic 2.5% |
| Immigrants | Bolivia | 0.2 /100 | #272 | Tragic 2.5% |
| Immigrants | Cameroon | 0.1 /100 | #273 | Tragic 2.5% |
| Ghanaians | 0.1 /100 | #274 | Tragic 2.6% |
| Immigrants | China | 0.1 /100 | #275 | Tragic 2.6% |
| Immigrants | Western Africa | 0.1 /100 | #276 | Tragic 2.6% |
| Immigrants | Philippines | 0.1 /100 | #277 | Tragic 2.6% |
| Immigrants | Uzbekistan | 0.1 /100 | #278 | Tragic 2.6% |
| Barbadians | 0.1 /100 | #279 | Tragic 2.6% |
| Trinidadians and Tobagonians | 0.1 /100 | #280 | Tragic 2.6% |
| Afghans | 0.1 /100 | #281 | Tragic 2.6% |