Swiss vs Hmong Associate's Degree
COMPARE
Swiss
Hmong
Associate's Degree
Associate's Degree Comparison
Swiss
Hmong
46.0%
ASSOCIATE'S DEGREE
40.4/ 100
METRIC RATING
182nd/ 347
METRIC RANK
43.4%
ASSOCIATE'S DEGREE
3.2/ 100
METRIC RATING
228th/ 347
METRIC RANK
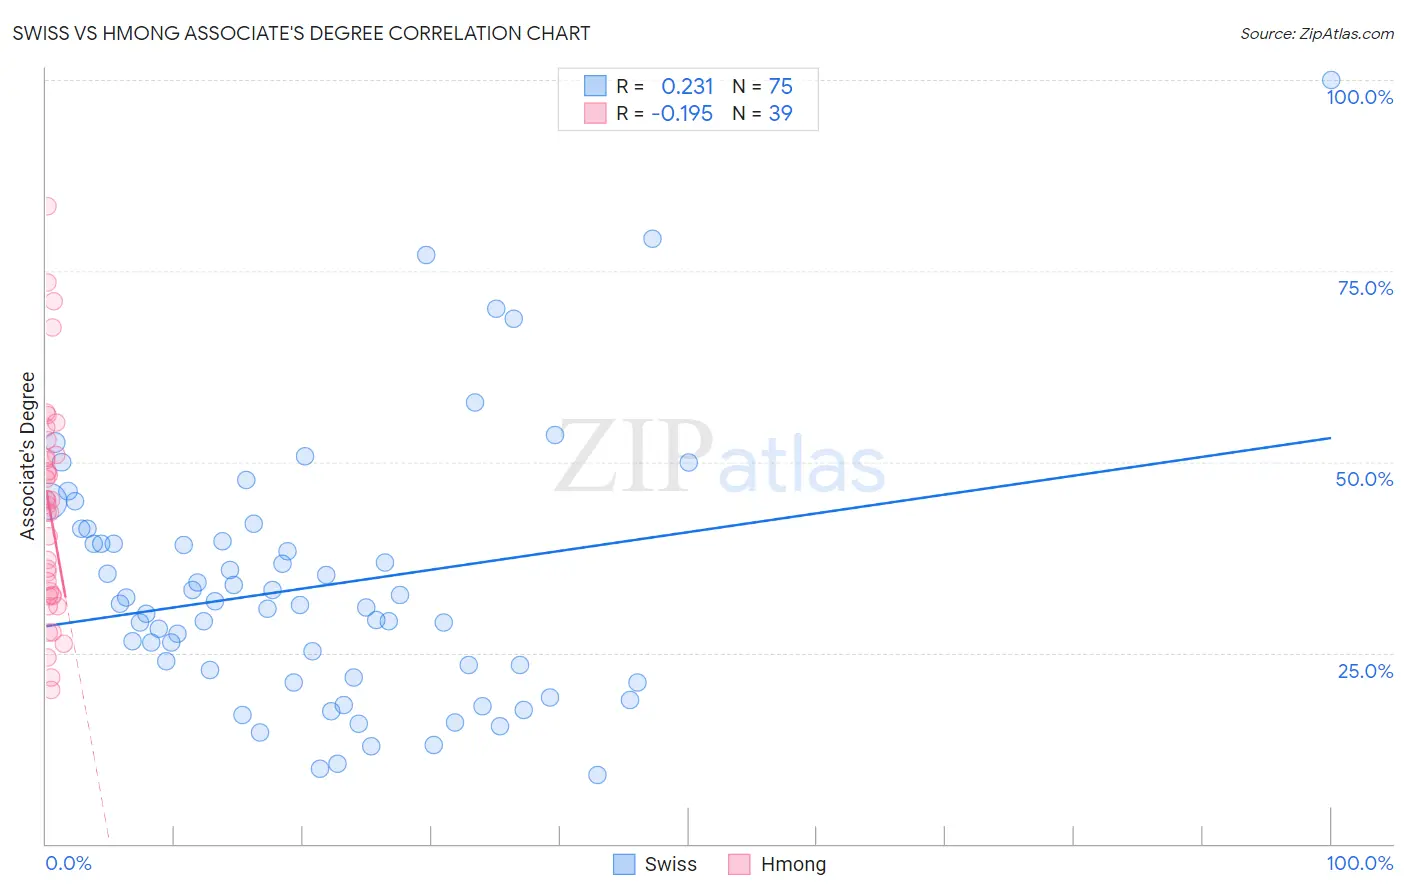
Swiss vs Hmong Associate's Degree Correlation Chart
The statistical analysis conducted on geographies consisting of 464,994,440 people shows a weak positive correlation between the proportion of Swiss and percentage of population with at least associate's degree education in the United States with a correlation coefficient (R) of 0.231 and weighted average of 46.0%. Similarly, the statistical analysis conducted on geographies consisting of 24,680,511 people shows a poor negative correlation between the proportion of Hmong and percentage of population with at least associate's degree education in the United States with a correlation coefficient (R) of -0.195 and weighted average of 43.4%, a difference of 6.0%.
Associate's Degree Correlation Summary
| Measurement | Swiss | Hmong |
| Minimum | 8.9% | 20.2% |
| Maximum | 100.0% | 83.4% |
| Range | 91.1% | 63.2% |
| Mean | 33.6% | 43.7% |
| Median | 31.2% | 44.4% |
| Interquartile 25% (IQ1) | 21.8% | 32.4% |
| Interquartile 75% (IQ3) | 39.6% | 50.9% |
| Interquartile Range (IQR) | 17.8% | 18.6% |
| Standard Deviation (Sample) | 16.9% | 14.5% |
| Standard Deviation (Population) | 16.8% | 14.3% |
Similar Demographics by Associate's Degree
Demographics Similar to Swiss by Associate's Degree
In terms of associate's degree, the demographic groups most similar to Swiss are Yugoslavian (46.0%, a difference of 0.010%), Czechoslovakian (46.0%, a difference of 0.030%), Immigrants from Colombia (46.0%, a difference of 0.070%), Costa Rican (46.0%, a difference of 0.14%), and Welsh (45.9%, a difference of 0.20%).
| Demographics | Rating | Rank | Associate's Degree |
| Belgians | 48.9 /100 | #175 | Average 46.3% |
| Finns | 48.5 /100 | #176 | Average 46.3% |
| Slovaks | 48.4 /100 | #177 | Average 46.3% |
| Immigrants | Bosnia and Herzegovina | 48.3 /100 | #178 | Average 46.3% |
| Sri Lankans | 47.6 /100 | #179 | Average 46.3% |
| Bermudans | 46.4 /100 | #180 | Average 46.2% |
| Immigrants | Colombia | 41.3 /100 | #181 | Average 46.0% |
| Swiss | 40.4 /100 | #182 | Average 46.0% |
| Yugoslavians | 40.2 /100 | #183 | Average 46.0% |
| Czechoslovakians | 40.0 /100 | #184 | Average 46.0% |
| Costa Ricans | 38.6 /100 | #185 | Fair 46.0% |
| Welsh | 37.9 /100 | #186 | Fair 45.9% |
| Immigrants | Uruguay | 35.5 /100 | #187 | Fair 45.8% |
| Ghanaians | 35.5 /100 | #188 | Fair 45.8% |
| Immigrants | Oceania | 34.7 /100 | #189 | Fair 45.8% |
Demographics Similar to Hmong by Associate's Degree
In terms of associate's degree, the demographic groups most similar to Hmong are Immigrants from Trinidad and Tobago (43.3%, a difference of 0.16%), Immigrants from Barbados (43.3%, a difference of 0.23%), Liberian (43.3%, a difference of 0.23%), Trinidadian and Tobagonian (43.6%, a difference of 0.44%), and Immigrants from Burma/Myanmar (43.7%, a difference of 0.62%).
| Demographics | Rating | Rank | Associate's Degree |
| Immigrants | Western Africa | 6.6 /100 | #221 | Tragic 44.1% |
| Barbadians | 5.8 /100 | #222 | Tragic 43.9% |
| Sub-Saharan Africans | 5.5 /100 | #223 | Tragic 43.9% |
| West Indians | 5.2 /100 | #224 | Tragic 43.8% |
| Guamanians/Chamorros | 4.8 /100 | #225 | Tragic 43.8% |
| Immigrants | Burma/Myanmar | 4.3 /100 | #226 | Tragic 43.7% |
| Trinidadians and Tobagonians | 4.0 /100 | #227 | Tragic 43.6% |
| Hmong | 3.2 /100 | #228 | Tragic 43.4% |
| Immigrants | Trinidad and Tobago | 3.0 /100 | #229 | Tragic 43.3% |
| Immigrants | Barbados | 2.9 /100 | #230 | Tragic 43.3% |
| Liberians | 2.9 /100 | #231 | Tragic 43.3% |
| Native Hawaiians | 2.3 /100 | #232 | Tragic 43.1% |
| Tongans | 2.2 /100 | #233 | Tragic 43.0% |
| Tlingit-Haida | 2.1 /100 | #234 | Tragic 43.0% |
| Ecuadorians | 2.0 /100 | #235 | Tragic 43.0% |