Swiss vs Immigrants from Ecuador Associate's Degree
COMPARE
Swiss
Immigrants from Ecuador
Associate's Degree
Associate's Degree Comparison
Swiss
Immigrants from Ecuador
46.0%
ASSOCIATE'S DEGREE
40.4/ 100
METRIC RATING
182nd/ 347
METRIC RANK
42.2%
ASSOCIATE'S DEGREE
0.8/ 100
METRIC RATING
248th/ 347
METRIC RANK
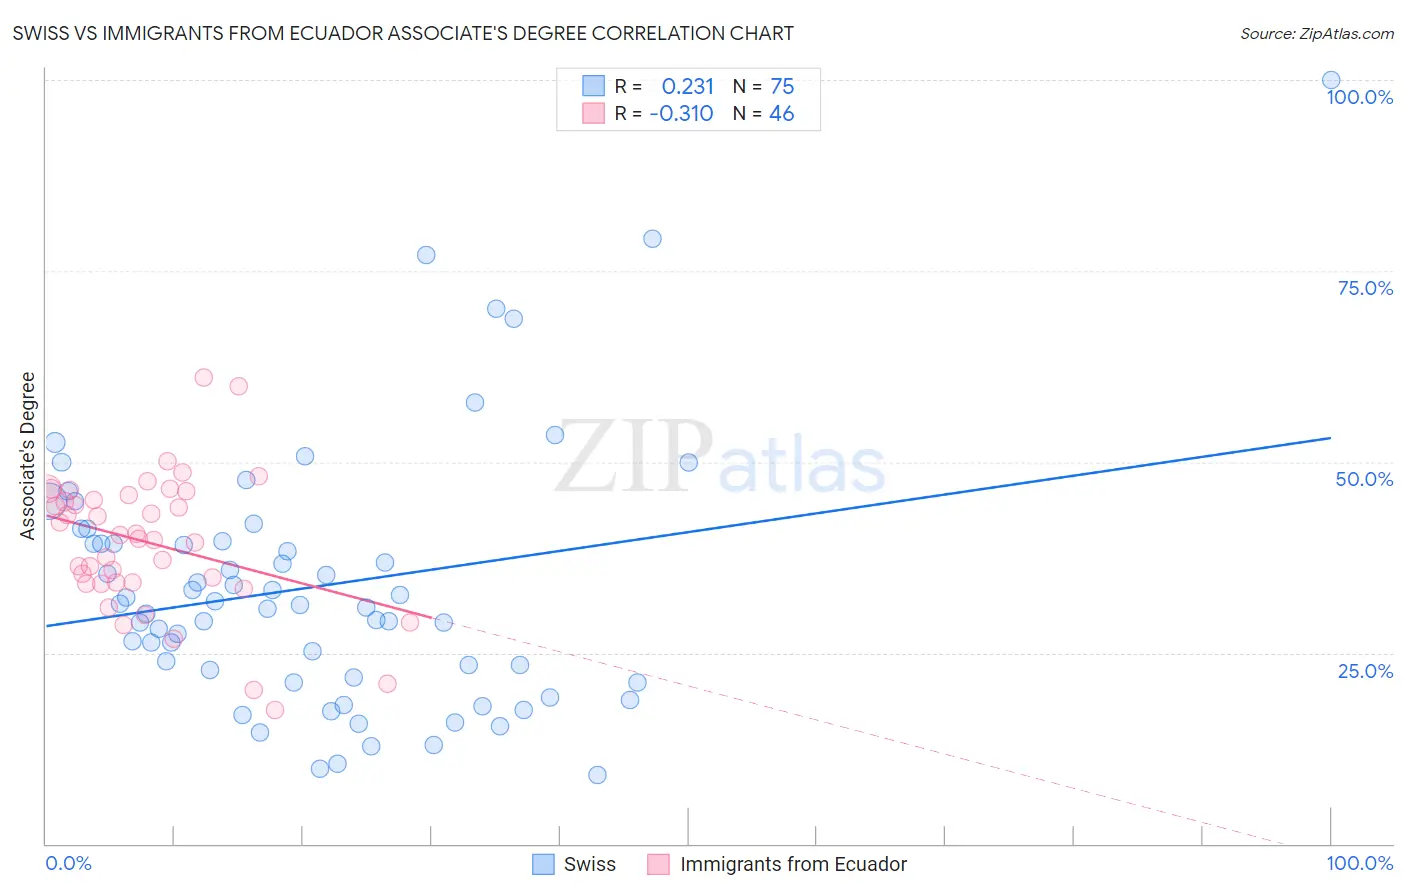
Swiss vs Immigrants from Ecuador Associate's Degree Correlation Chart
The statistical analysis conducted on geographies consisting of 464,994,440 people shows a weak positive correlation between the proportion of Swiss and percentage of population with at least associate's degree education in the United States with a correlation coefficient (R) of 0.231 and weighted average of 46.0%. Similarly, the statistical analysis conducted on geographies consisting of 271,013,289 people shows a mild negative correlation between the proportion of Immigrants from Ecuador and percentage of population with at least associate's degree education in the United States with a correlation coefficient (R) of -0.310 and weighted average of 42.2%, a difference of 9.1%.
Associate's Degree Correlation Summary
| Measurement | Swiss | Immigrants from Ecuador |
| Minimum | 8.9% | 17.6% |
| Maximum | 100.0% | 61.0% |
| Range | 91.1% | 43.4% |
| Mean | 33.6% | 39.4% |
| Median | 31.2% | 40.1% |
| Interquartile 25% (IQ1) | 21.8% | 34.2% |
| Interquartile 75% (IQ3) | 39.6% | 45.6% |
| Interquartile Range (IQR) | 17.8% | 11.4% |
| Standard Deviation (Sample) | 16.9% | 9.0% |
| Standard Deviation (Population) | 16.8% | 8.9% |
Similar Demographics by Associate's Degree
Demographics Similar to Swiss by Associate's Degree
In terms of associate's degree, the demographic groups most similar to Swiss are Yugoslavian (46.0%, a difference of 0.010%), Czechoslovakian (46.0%, a difference of 0.030%), Immigrants from Colombia (46.0%, a difference of 0.070%), Costa Rican (46.0%, a difference of 0.14%), and Welsh (45.9%, a difference of 0.20%).
| Demographics | Rating | Rank | Associate's Degree |
| Belgians | 48.9 /100 | #175 | Average 46.3% |
| Finns | 48.5 /100 | #176 | Average 46.3% |
| Slovaks | 48.4 /100 | #177 | Average 46.3% |
| Immigrants | Bosnia and Herzegovina | 48.3 /100 | #178 | Average 46.3% |
| Sri Lankans | 47.6 /100 | #179 | Average 46.3% |
| Bermudans | 46.4 /100 | #180 | Average 46.2% |
| Immigrants | Colombia | 41.3 /100 | #181 | Average 46.0% |
| Swiss | 40.4 /100 | #182 | Average 46.0% |
| Yugoslavians | 40.2 /100 | #183 | Average 46.0% |
| Czechoslovakians | 40.0 /100 | #184 | Average 46.0% |
| Costa Ricans | 38.6 /100 | #185 | Fair 46.0% |
| Welsh | 37.9 /100 | #186 | Fair 45.9% |
| Immigrants | Uruguay | 35.5 /100 | #187 | Fair 45.8% |
| Ghanaians | 35.5 /100 | #188 | Fair 45.8% |
| Immigrants | Oceania | 34.7 /100 | #189 | Fair 45.8% |
Demographics Similar to Immigrants from Ecuador by Associate's Degree
In terms of associate's degree, the demographic groups most similar to Immigrants from Ecuador are Immigrants from Fiji (42.2%, a difference of 0.090%), Jamaican (42.1%, a difference of 0.14%), U.S. Virgin Islander (42.1%, a difference of 0.16%), Delaware (42.3%, a difference of 0.18%), and Immigrants from Bahamas (42.1%, a difference of 0.18%).
| Demographics | Rating | Rank | Associate's Degree |
| British West Indians | 1.0 /100 | #241 | Tragic 42.4% |
| Immigrants | West Indies | 1.0 /100 | #242 | Tragic 42.4% |
| Guyanese | 1.0 /100 | #243 | Tragic 42.3% |
| Immigrants | Liberia | 0.9 /100 | #244 | Tragic 42.3% |
| Immigrants | Cambodia | 0.9 /100 | #245 | Tragic 42.3% |
| Delaware | 0.9 /100 | #246 | Tragic 42.3% |
| Immigrants | Fiji | 0.8 /100 | #247 | Tragic 42.2% |
| Immigrants | Ecuador | 0.8 /100 | #248 | Tragic 42.2% |
| Jamaicans | 0.7 /100 | #249 | Tragic 42.1% |
| U.S. Virgin Islanders | 0.7 /100 | #250 | Tragic 42.1% |
| Immigrants | Bahamas | 0.7 /100 | #251 | Tragic 42.1% |
| French American Indians | 0.6 /100 | #252 | Tragic 42.0% |
| Indonesians | 0.6 /100 | #253 | Tragic 41.9% |
| Cubans | 0.6 /100 | #254 | Tragic 41.9% |
| Immigrants | Guyana | 0.5 /100 | #255 | Tragic 41.8% |